The Best Self-Service BI Tools: What Actually Works (And What Doesn't)
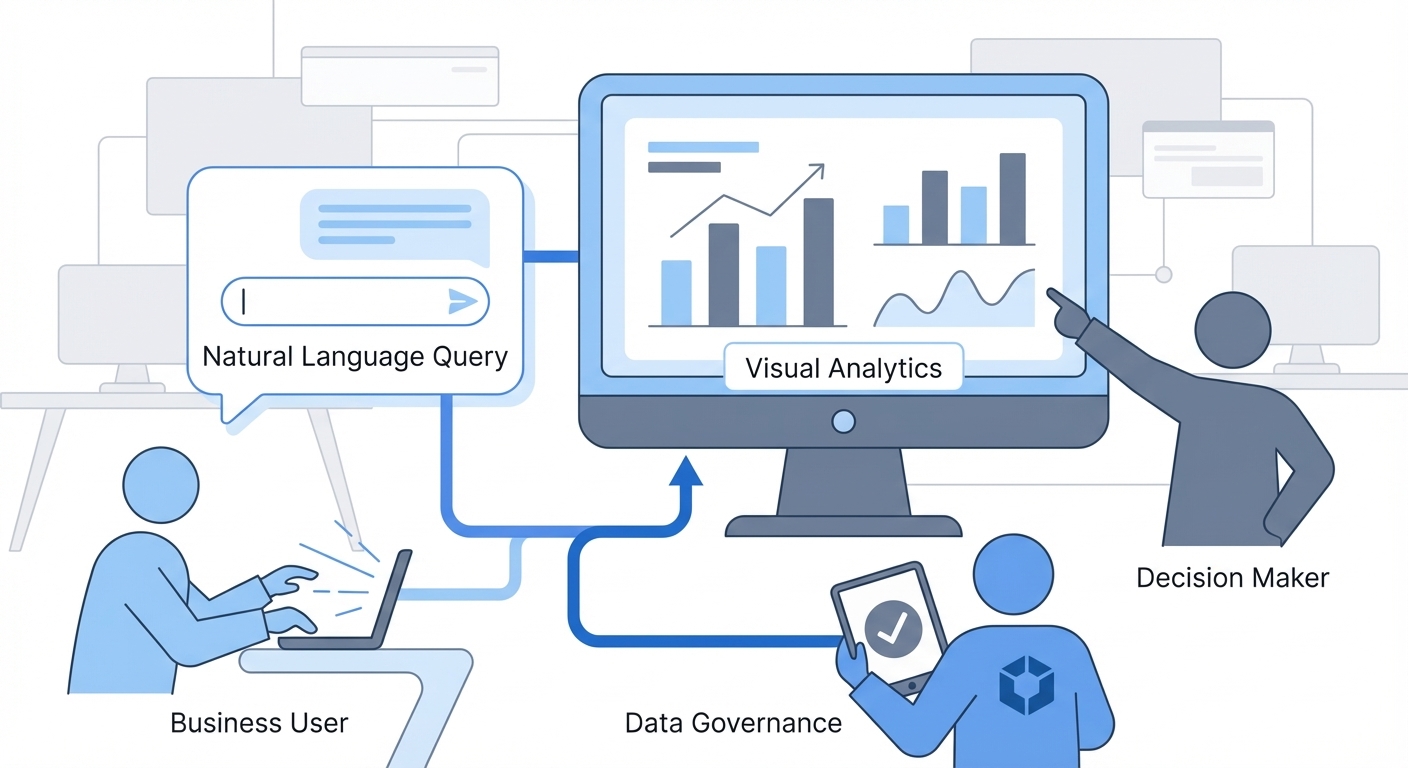
Self-service BI tools promise a dream scenario: anyone in your organization gets data insights immediately, no ticket required. The pitch is compelling—faster decisions, zero bottlenecks, democratized data.
The reality is brutal. 60% of BI projects fail to deliver business value. Adoption rates have been stuck at ~25% for nearly a decade, even as companies pour billions into the stack.
This isn't a fluff listicle ranking tools by feature count. Research shows tool selection is only about 20% of the equation. What matters is why self-service fails and which operating model actually works. Once you understand that, you can pick the tool that fits.

TL;DR: What You Need to Know
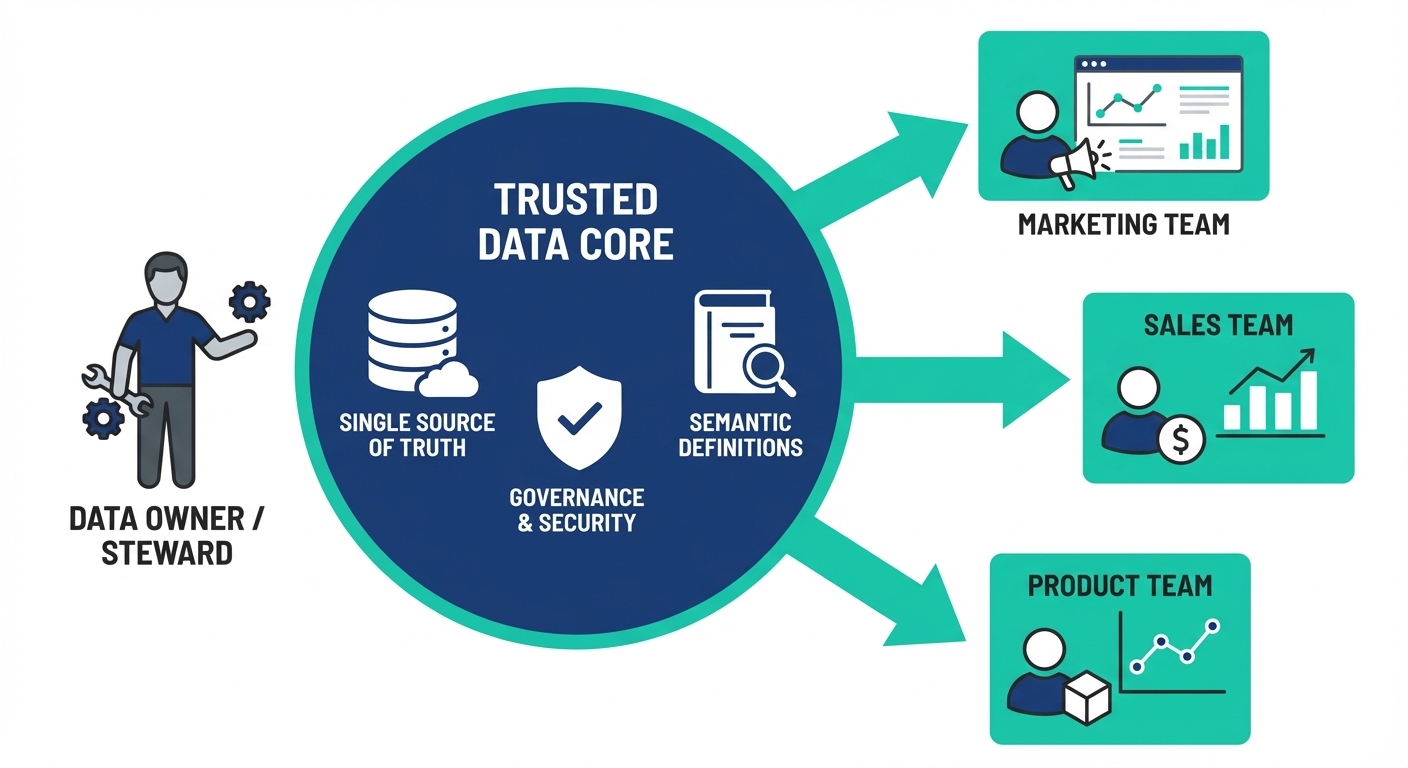
The hard truth: "Self-service" doesn't mean "anyone can do anything." Successful setups use a "managed self-service" model—someone owns the data layer/definitions, and everyone else self-serves on top.
What actually works:
- AI-native tools (built for AI, not legacy tools with a chatbot bolted on) drastically lower barriers.
- A semantic layer is non-negotiable for reliability.
- Adoption is the only metric that matters, and it depends on speed from question to answer.
What doesn't work:
- Deploying tools without training or governance.
- "Federated" models where every department builds their own siloed logic.
- Expecting dashboards to answer ad-hoc questions they weren't designed for.
The shortlist: Power BI and Tableau dominate market share. BlazeSQL leads on LLM-native natural language (no keyword training needed). ThoughtSpot leads on search-based querying at enterprise scale. Metabase and Looker Studio are your best free/open-source bets.
Not sure where to start? Take this 2-minute assessment for a personalized recommendation.
Find the right self-service BI tool for your team based on your specific requirements and constraints.
What "Self-Service BI" Actually Means
Gartner defines self-service BI as "end users designing and deploying their own reports and analyses within an approved and supported architecture and tools portfolio."
The key phrase here is "within an approved and supported architecture." True self-service isn't a free-for-all. It's guided autonomy.
The Evolution
- Traditional BI (Pre-2010s): IT builds everything. You submit a ticket and wait two weeks.
- Self-Service BI 1.0 (2010s): Drag-and-drop visuals. You still need to understand data models to use it.
- Self-Service BI 2.0 (2020s): Natural language querying. You ask questions in plain English. This is where the category is heading.
IBM puts it simply: "enables stakeholders to analyze data without IT or data science expertise."
The "without expertise" part is crucial. It's also where most tools fail.
Why Most Self-Service BI Fails
Before looking at tools, you need to understand the failure modes. The problems usually aren't technical—they're operational.
1. The Semantic Layer Gap
Most tools assume users understand the business logic baked into the data. They don't.
Definitions for "active user" or "revenue" live in people's heads. Without a semantic layer codifying these, users create conflicting reports.
As one practitioner noted on Reddit: "Over time, executives lose faith in the data. Meetings devolve into arguments over whose numbers are right instead of making decisions."
2. Data Literacy ≠ Domain Expertise
Your marketing team knows marketing. That doesn't mean they know how to translate questions into data queries, even with "no-code" builders.
DataCamp's 2024 research backs this up: 86% of leaders say data literacy is vital, yet 55% of users lack confidence in BI tools.
3. Report Proliferation
Ungoverned self-service creates a mess: thousands of one-off reports that nobody maintains.
This is technical debt. It leads to conflicting definitions and zero "single source of truth."
4. The Federated Model Failure
Some orgs let every department manage their own BI. This almost always fails.
What Actually Works: The Managed Self-Service Model
Successful orgs share a common approach: centralized datasets, decentralized report creation.
Microsoft calls this "managed self-service BI." Users build reports on certified, governed data sources maintained by a smaller team.
The Playbook
- Someone owns the data layer. It doesn't need to be a massive team. A single lead or RevOps function can maintain definitions and governance.
- Users self-serve within guardrails. They ask questions and build visuals on curated data—not raw production tables.
- Context is captured. Business logic and tribal knowledge are documented inside the tool, not on a wiki nobody reads.
- Transparency is mandatory. You must be able to see what questions users ask to control quality.
Newer AI-native tools are designed specifically for this model, making it easier to implement than ever.

15 Best Self-Service BI Tools Compared
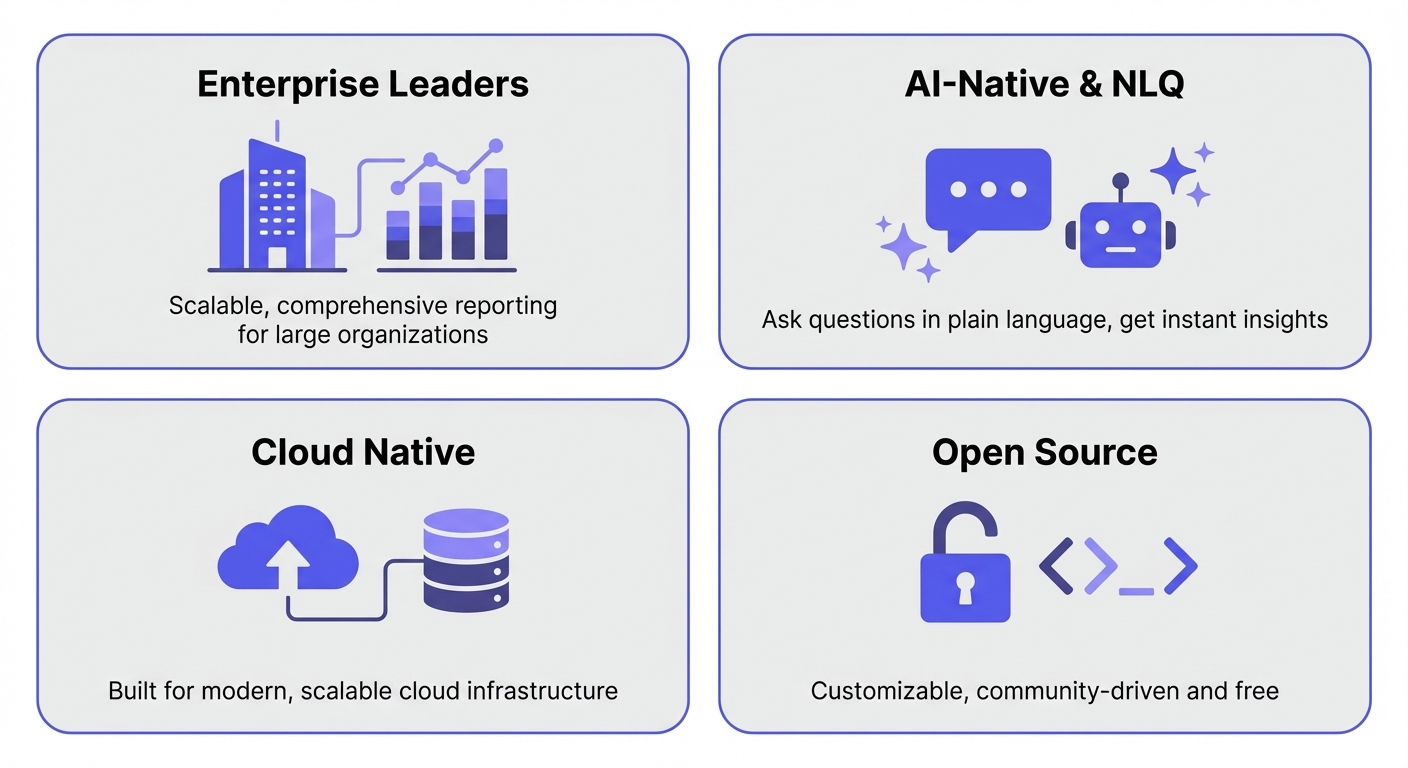
I've organized these by category so you can ignore the ones that don't fit your stack.
Enterprise BI Leaders
These are the Gartner Magic Quadrant leaders. Best if you have complex requirements and dedicated BI resources.
Microsoft Power BI
Best for: Microsoft-centric organizations.
Power BI dominates the market for a reason: deep integration with Excel, Azure, and Teams.
Pricing: Free tier available. Pro at $14/user/month (starting April 2025). Premium Per User at $24/user/month.
Self-service capabilities: "Q&A" for natural language; Copilot for AI-assisted reporting (premium). The drag-and-drop interface is approachable but has a learning curve.
Governance: Strong enterprise controls—row-level security, lineage, audit logs, and certification.
Data connections: 250+ native connectors.
Limitations: Copilot is still early-stage. The tool can overwhelm non-technical users despite the "self-service" marketing.
Tableau (Salesforce)
Best for: Organizations prioritizing data visualization.
Tableau pioneered visual analytics and remains the gold standard for depth. The drag-and-drop is powerful, but mastery takes time.
Pricing: Creator ($75/user/month), Explorer ($42/user/month), Viewer ($15/user/month). Free Tableau Public available.
Self-service capabilities: "Ask Data" for natural language; Tableau Pulse for AI insights.
Governance: Row-level security via Virtual Connections, Tableau Catalog for lineage.
Data connections: 100+ native connectors.
Limitations: Expensive. "Ask Data" works in demos but struggles with complex real-world schemas.
Qlik Sense
Best for: Flexible data exploration.
Qlik's associative engine allows users to explore data freely without predefined hierarchies. You click a data point and see connections instantly.
Pricing: Starter ($200/mo for 10 users), Standard ($825/mo), Premium ($2,750/mo). Capacity-based.
Self-service capabilities: Insight Advisor for search; Qlik Answers for GenAI querying.
Governance: "Section Access" for row/column security, lineage, logs.
Data connections: Hundreds of connectors (relational, cloud, SaaS).
Limitations: Costs add up fast. The associative model requires a mental shift for users used to traditional BI.
AI-Native Analytics Platforms
These aren't legacy tools with a chatbot added. They were built for the "ask a question, get an answer" model.
BlazeSQL
Best for: Teams needing reliable natural language querying without massive setup.
BlazeSQL connects to SQL databases and lets users query via natural language.
Pricing: Seat-based. Starts ~$400/month for 3 users (Standard), $800/month (Advanced).
Self-service capabilities: Natural language to SQL generation with visuals. Users can save queries to dashboards and get AI-powered weekly change reports.
Governance: Role-based access, table/column restrictions, and a query review interface to monitor user activity.
Data connections: Snowflake, BigQuery, Redshift, PostgreSQL, MySQL, SQL Server, ClickHouse, Databricks, and more.
Limitations: Not for pixel-perfect reporting. Focused on SQL databases, so it won't replace tools for CSV analysis.
Why it's different: Reliability. Most AI-to-SQL tools fail because the AI lacks context. BlazeSQL uses knowledge notes (definitions), training questions (teaching the AI), and passive learning to make the AI reliable enough for production.
ThoughtSpot
Best for: Search-first analytics at enterprise scale.
ThoughtSpot pioneered search-driven analytics. Users type questions like a Google search. They've recently doubled down with their Spotter AI Agent.
Pricing: Pro at $50/user/month (min 25 users), Enterprise by quote.
Self-service capabilities: Natural Language Search is the core interface. Spotter AI for conversational insights.
Governance: Row/column-level security, SOC 2 / ISO 27001, audit logging.
Data connections: 400+ connectors, live query to cloud warehouses.
Limitations: Minimum user counts are steep for small teams. Requires a pristine data warehouse model.
Cloud Data Warehouse Native
These tools query data directly in your warehouse without extraction.
Google Looker
Best for: Strong governance with flexible exploration.
Looker's LookML semantic layer is its superpower and its barrier to entry. It ensures consistent metrics, but you need devs to build it.
Pricing: Quote-based. Licenses for Developer, Standard, Viewer.
Self-service capabilities: Conversational Analytics (natural language). "Explores" for self-service within LookML models.
Governance: LookML is the semantic layer. Row-level security, content certification, lineage.
Data connections: 300+ connectors, optimized for BigQuery.
Limitations: LookML requires developer skills. Primarily cloud-only.
Sigma Computing
Best for: Finance and analytics teams who live in spreadsheets.
Sigma looks like Excel but runs directly on cloud warehouses. You can crunch billions of rows without exporting.
Pricing: Quote-based. Tiers: View, Act, Analyze, Build.
Self-service capabilities: "Ask Sigma" for natural language. Spreadsheet interface for analysis.
Governance: Row/column security, audit logs, lineage tracking.
Data connections: Snowflake, BigQuery, Redshift, Databricks, Postgres, MySQL.
Limitations: Fewer native connectors than competitors. Cloud-only.
AWS QuickSight
Best for: AWS-native organizations wanting low costs.
The most affordable entry point if you're already on AWS. Tight integration with S3, Redshift, and Athena.
Pricing: Standard ($9/user/mo), Enterprise Author ($24/user/mo). Reader pricing starts at $0.50/session (pay-per-use).
Self-service capabilities: "Amazon Q" for natural language and generative BI.
Governance: Row-level security, CloudTrail auditing.
Data connections: 50+ connectors, optimized for AWS.
Limitations: Locked to AWS. Some governance features require separate licenses.
All-in-One Platforms
Tools that combine integration, prep, and BI.
Domo
Best for: Getting integration and BI in one box.
Domo combines ETL, warehousing, and BI. Unique consumption-based pricing (no per-user fees).
Pricing: Consumption-based (quote). Estimates: $50K-$500K+ annually.
Self-service capabilities: DomoGPT for AI. Magic ETL for visual data prep. Great mobile app.
Governance: Role-based access, lineage, certification, environment separation.
Data connections: 1,000+ connectors.
Limitations: Premium pricing. Overkill if you already have a modern data warehouse.
MicroStrategy
Best for: Large enterprises with high-volume needs.
A BI veteran. "Strategy One" is their AI-enhanced platform.
Pricing: Starts at $13/user/month (50-300 users).
Self-service capabilities: MicroStrategy AI for natural language queries/dashboards. Strong semantic layer.
Governance: Enterprise-grade (HIPAA, GDPR, SOC 2).
Data connections: 100+ connectors.
Limitations: Historically complex implementation. Best for massive deployments.
Open Source and Budget-Friendly Options
Strong capabilities, lower cost, some trade-offs.
Metabase
Best for: Startups and open-source flexibility.
The most popular open-source tool. Simple setup, accessible interface.
Pricing: Open Source (free/self-hosted). Cloud Starter ($100/mo + $6/user). Pro ($575/mo).
Self-service capabilities: Metabot AI for natural language/SQL gen. Simple question builder.
Governance: Row-level security (Pro/Enterprise). Usage analytics.
Data connections: 18+ official connectors.
Limitations: Fewer connectors than enterprise tools. Self-hosting requires maintenance.
Apache Superset
Best for: Technical teams wanting free, scalable visualization.
A true open-source project (Apache Foundation). No vendor lock-in.
Pricing: Free (Apache License). Managed hosting via Preset (~$25/user/mo).
Self-service capabilities: No native NLQ in open source (Preset offers Text-to-SQL). 40+ chart types.
Governance: Row-level security via SQL filters.
Data connections: 50+ connectors.
Limitations: Requires technical resources. No native NLQ without add-ons.
Zoho Analytics
Best for: SMBs and the Zoho ecosystem.
Solid BI at accessible pricing.
Pricing: Free plan available. Standard ($48/mo), Premium ($115/mo), Enterprise ($455/mo).
Self-service capabilities: "Ask Zia" conversational AI. Auto-analysis reports.
Governance: Fine-grained access, audit logs.
Data connections: 500+ connectors.
Limitations: Advanced features gated behind higher tiers.
Looker Studio (Google Data Studio)
Best for: Google ecosystem users needing free reporting.
The lowest barrier to entry. Genuinely free.
Pricing: Free. Pro at $9/user/project/month.
Self-service capabilities: Gemini AI integration. Strong Google Analytics/Ads integration.
Governance: Basic (email filters for security).
Data connections: 1,320+ connectors (mostly Google ecosystem).
Limitations: Basic governance. Performance lags on large datasets.

Feature Comparison Matrix
| Tool | Starting Price | AI Architecture | Deployment | Best For |
|---|---|---|---|---|
| Power BI | Free / $14/user/mo | Bolt-on (Copilot) | Cloud + On-prem | Microsoft ecosystem |
| Tableau | $15/user/mo | Bolt-on (Ask Data) | Cloud + On-prem | Data visualization |
| BlazeSQL | ~$400/mo (3 users) | LLM-Native | Cloud + Desktop | Natural language querying |
| Qlik Sense | $200/mo (10 users) | Bolt-on (Qlik Answers) | Hybrid | Flexible exploration |
| ThoughtSpot | $50/user/mo | Search-Native (keyword) | Cloud | Search-driven analytics |
| Looker | Contact | Bolt-on (limited) | Cloud | Governed self-service |
| Sigma | Contact | Bolt-on (Ask Sigma) | Cloud | Spreadsheet users |
| QuickSight | $9/user/mo | Bolt-on (Amazon Q) | Cloud (AWS) | AWS organizations |
| Domo | Contact | Bolt-on (DomoGPT) | Cloud | All-in-one platform |
| MicroStrategy | $13/user/mo | Bolt-on | Hybrid | Large enterprise |
| Metabase | Free / $100/mo | Bolt-on (Metabot) | Self-hosted + Cloud | Open source |
| Superset | Free | None | Self-hosted + Cloud | Technical teams |
| Zoho Analytics | Free / $48/mo | Bolt-on (Ask Zia) | Hybrid | SMBs, Zoho users |
| Looker Studio | Free | Bolt-on (limited) | Cloud | Google ecosystem |
AI Architecture matters:
- LLM-Native: Built around large language models from day one. Understands natural language, learns from corrections, adapts to your schema without extensive setup.
- Search-Native: Keyword-based search (like ThoughtSpot's original engine). Requires specific phrasing and extensive synonym configuration.
- Bolt-on: AI added to existing tools. Often inconsistent and requires the underlying data model to be perfectly structured first.
How to Evaluate Self-Service BI Tools
Feature checklists don't predict success. Ignore them. Here is the only test that matters.
The "Real-Question" POC
Test the tool with actual business questions—not the vendor's demo dataset.
- Compile 10-20 real questions your business users ask. Mix easy ("revenue last week") and hard ("churn rate by cohort").
- Include questions that should fail. Test the tool's ability to learn and improve.
- Score correctness. Can it answer accurately? If not, can you teach it?
- Measure iteration time. How fast can a user refine a question to get the right answer?
- Use real users. The way actual humans ask questions is messy. Test that.
Key Criteria
- Reliability: Can you teach the tool your business logic? How does it handle edge cases?
- Transparency: Can you see the queries it generates? Essential for debugging.
- Time to value: Does it take weeks to configure, or does it work day one?
- Adoption path: Is there a clear process to roll this out to more teams?
Red Flags
- Extensive setup required. If it doesn't provide value immediately, adoption will stall.
- Vendor configuration. If "self-service" requires a vendor to set it up, it's not self-service.
- Perfect demos. Demand to use your own data.
- No learning mechanism. If the AI makes a mistake and you can't teach it the correct logic, it's a toy, not a tool.
Need help narrowing down? Our assessment tool does the heavy lifting for you.
Answer a few questions about your team, data stack, and priorities to get matched with the right tools.
Implementation Best Practices
Even the best tool fails if you ship it wrong.
Microsoft's 14-Subject-Area Framework
This is the gold standard for implementation planning:
- BI Strategy – Align with goals.
- Tenant Setup – Configuration matters.
- Licenses – Right-size early.
- Workspaces – Design for organization.
- Lifecycle – Dev → Test → Production.
- Security – Row-level and object-level.
- Protection – Sensitivity labels/DLP.
- Gateways – Connect on-prem data.
- Auditing – Track everything.
- Adoption – Measure success.
The Phased Rollout
- Week 1-2: Build training questions. Fix knowledge gaps. Test with the data team.
- Week 3-4: Invite one business team (marketing or product usually works best).
- Month 2: Monitor queries. Add knowledge notes. Gather feedback.
- Month 3+: Expand to other teams based on what worked.
What Takes Longer Than Expected
- Data quality. Tools don't fix messy source data.
- Definitions. Getting stakeholders to agree on "churn" is harder than picking software.
- Change management. People hate changing habits.
- Governance. Setting up proper access controls.
TCO: The Real Cost of Self-Service BI
License fees are usually 5-10% of total ownership costs. Here's the math for a 200-user org.
| Category | Year 1 Cost | Ongoing Annual |
|---|---|---|
| Software licenses | $30-50K | $30-50K |
| Implementation | $100-200K | - |
| Training | $30-50K | $15-25K |
| Internal staff (analysts/admins) | $150-300K | $150-300K |
| Governance overhead | $50-100K | $30-50K |
| Infrastructure | $20-50K | $20-50K |
| Total | $380-750K | $245-475K |
The 3-Year Rule: Your actual TCO is typically 3-5x the license cost.
ROI Drivers vs. Killers
- Driver: Adoption. At 40%+ adoption, ROI compounds.
- Killer: Low adoption. If users don't trust it, they won't use it.
- Killer: Report proliferation. Thousands of junk reports.
- Killer: Over-governance. Too many barriers kill agility.
Industry-Specific Considerations
- Healthcare: HIPAA is non-negotiable. Look for encryption, RBAC, and BAAs. (Power BI, Tableau, Qlik).
- Finance: SOX/GDPR require lineage and audit trails. (MicroStrategy, Qlik).
- Retail: Real-time analytics and PCI DSS. (Power BI, Looker, Domo).
- Manufacturing: ERP/IoT integration is key. (Power BI, SAP).
- Government: FedRAMP is mandatory. (Power BI GCC, Tableau).
Making Your Decision
Self-service BI isn't about the "best" tool. It's about the right tool for your operating model.
- Microsoft shop + BI team? Power BI is the safe bet.
- Visualization priority? Tableau is still king.
- True natural language (LLM-native)? BlazeSQL. Works with messy questions, learns from corrections.
- Search-based querying? ThoughtSpot. Requires keyword training but scales well at enterprise.
- Open source + Community? Metabase.
- Zero Budget? Looker Studio or Zoho Analytics.
- Governance above all? Looker (if you have the devs to build LookML).
Remember: The managed self-service model works regardless of the tool. Centralize the data layer. Let users self-serve on top.
Whether you're in the 40% who succeed or the 60% who fail depends more on how you implement than what you implement.


I think self-service only works when you also invest in a real semantic layer. Most tools assume users know the business logic. They don't.
View on Reddit