


Top 8 No-Code Data Analytics Platforms in 2026

Data now floods every corner of business, yet there never seem to be enough analysts to turn that raw data into valuable insights. To bridge this gap, organisations are increasingly equipping non-technical staff with no-code analytics tools.
In fact, a 2024 Tadabase report confirms the shift: more businesses are leaning towards no-code data analytics platforms, and that momentum is poised to accelerate through 2026.
This guide breaks down the top no-code analytics platforms, including BlazeSQL, PowerBI, Tableau, and Zoho Analytics, among others. We’ll highlight their standout features and help you choose the best fit for your business.
Whether you’re a founder aiming to accelerate data-driven decisions or a team that needs answers without writing SQL, read on to discover the no-code tools set to define data analytics in 2026.
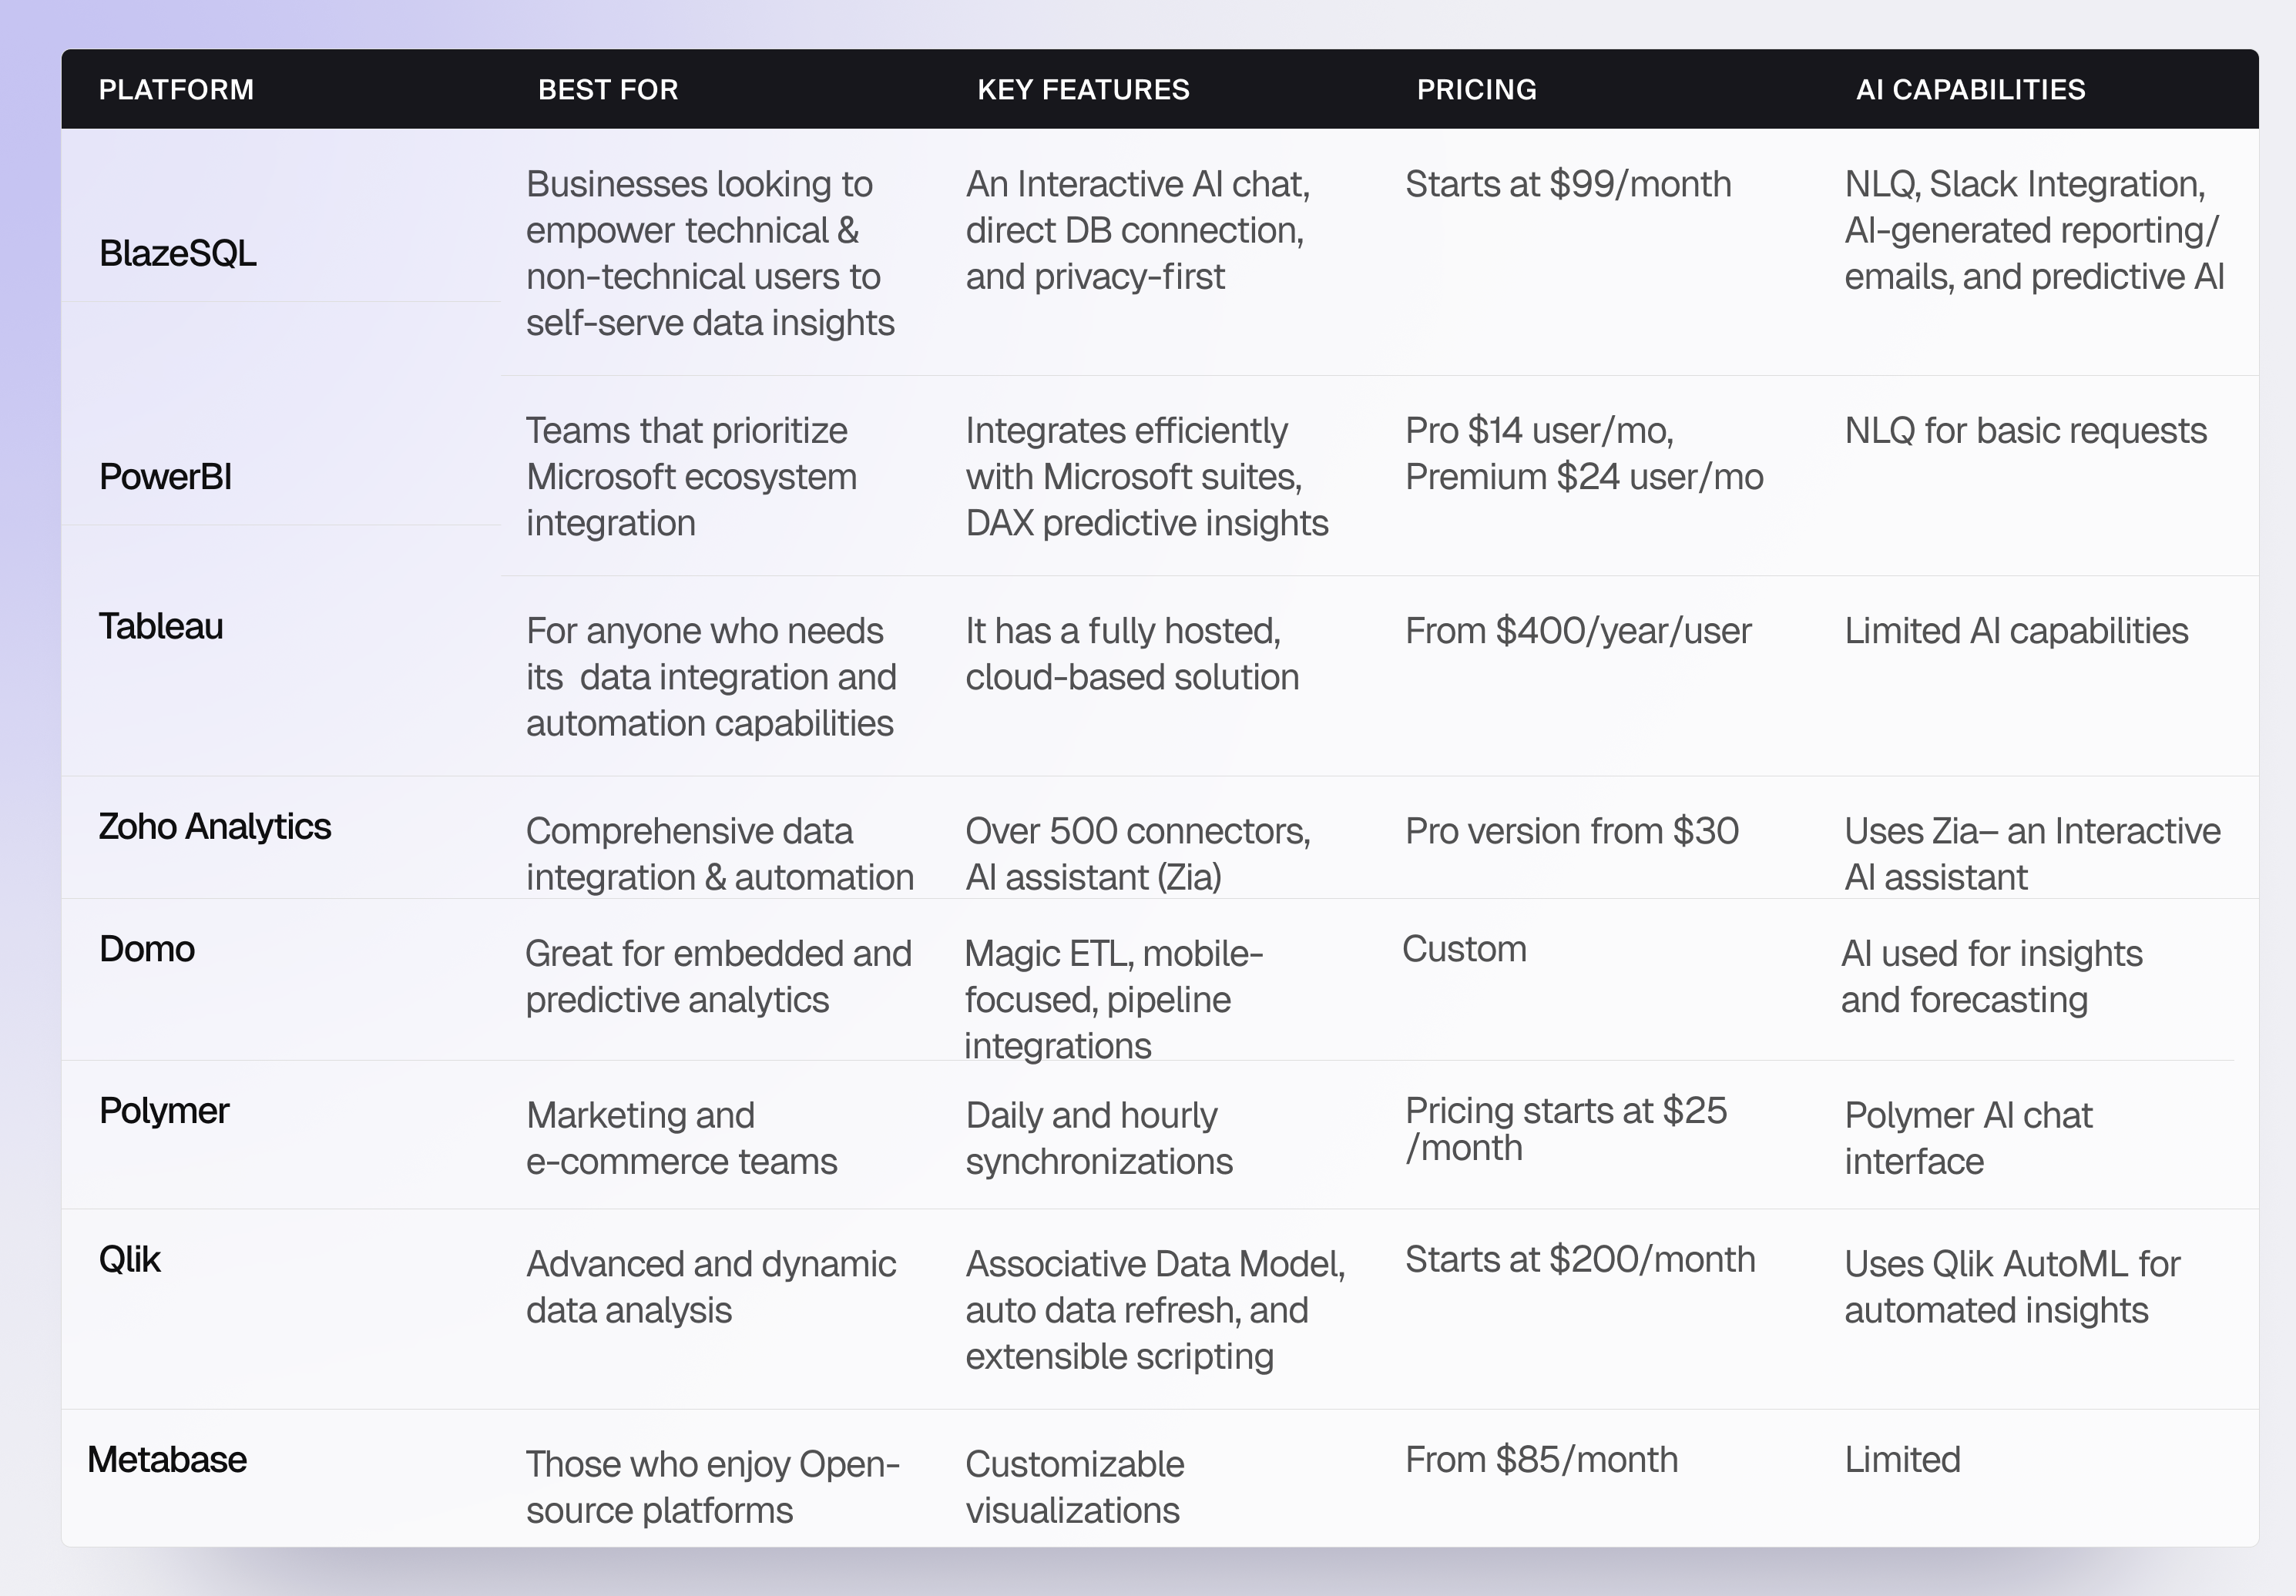
1. BlazeSQL
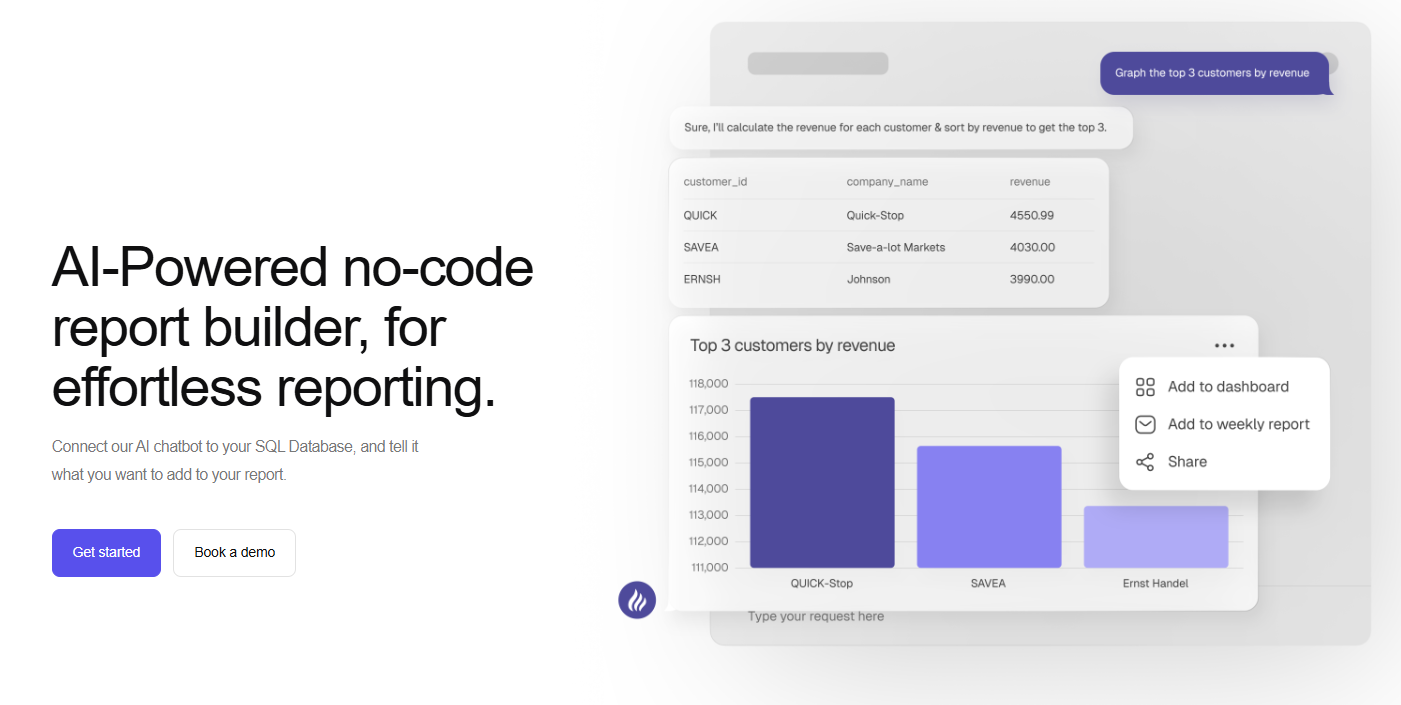
BlazeSQL is an AI-powered, no-code analytics platform and personal data analyst that helps you turn your business questions into data insights. Just type what you need in natural language, and it takes care of writing the SQL code, running queries, and displaying useful visualizations.
Anyone on your team can easily pick it up and generate insights, as well as build a dashboard, simply by interacting with the AI Chat interface. Blaze supports a wide range of SQL databases, including Snowflake, PostgreSQL, MySQL, Microsoft SQL Server, AWS Redshift, and BigQuery. The platform allows you to connect your databases in minutes.
BlazeSQL is ideal for business executives, data analysts or business users—anyone who needs fast and rich insights without writing SQL.
Key Features
- Natural language query: BlazeSQL is a personal data analyst that turns data questions in plain English into accurate insights. When you ask a data question, the AI writes optimized SQL codes and returns results in the most useful format.
- Visualization and dashboards: Turn results into shareable charts, graphs, and live dashboards with a click. Ask the chatbot to tweak visuals or explain any metric on demand.
- Enterprise-grade privacy: BlazeSQL’s AI only sees table & column names, and the desktop app keeps query results local; nothing leaves your network.
- Proactive insights & email reports: The AI surfaces weekly insights and can send automated report emails.
- Automated Actions & Triggers: BlazeSQL lets you send emails, call APIs, or trigger webhooks directly from chats or dashboards, turning insights into instant workflows.
- Slack integration: Mention @Blaze in any channel or thread and it parses the conversation, runs the right database queries, then responds with an interactive chart or drill-down. If you need to dig deeper, Blaze automatically hands you a linked Google Sheet with the full results.
Pros
- On-demand “AI data analyst” for fast and accurate insights
- Fast onboarding and ongoing product support
- Eliminates manual SQL writing, truly no-code
- Secure, direct database connections
- Gentle learning curve for non-technical users
- Flexible deployment and customization options
Cons
- 300-table cap per database
- Limited to SQL databases
Curious to see BlazeSQL in action?
2. PowerBI
Power BI is a no-code analytics and visualization platform. Business users can connect to almost any data source, including Excel files, cloud apps, and on-prem databases, and build interactive reports or dashboards through drag-and-drop visuals or natural-language queries powered by Copilot. Recent updates include enhanced language understanding, Copilot-generated DAX, Direct Lake semantic models for improved query performance, and a low-code AutoML experience for forecasting and classification tasks.
Key Features
- Broad data integration that connects to text/CSV, on-prem SQL, SaaS apps, etc.
- Low-code AutoML to build predictive models
- Robust data modeling
- CRM & marketing connectors
Pros
- Strong data visualization capabilities
- Broad range of learning resources
- Custom visuals library
Cons
- Overwhelming user interface
- Rigid formulas limit flexibility
3. Zoho Analytics
When your data lives in too many places to count, such as SQL, Excel, and unstructured sources, and you need answers without writing a line of code, think Zoho Analytics.
The AI-powered BI platform connects to over 500 data sources with just a few clicks, allowing you to blend, visualize, and share insights through a drag-and-drop interface.
Its AI assistant, Zia, answers questions in plain English, creates reports on the fly, and surfaces predictive insights, making Zoho Analytics a smart fit for teams that want enterprise-grade analytics without relying on developers or data engineers.
Key Features
- Connect and blend data from over 500 sources, covering nearly any data landscape
- Interactive AI assistant “Zia” answers data questions in real time
- Predictive AI for forecasting, trend & anomaly detection
- Drag-and-drop dashboard builder
Pros
- Extensive data source integrations
- It has strong AI capabilities for analysis and visualization
- Secure role-based sharing
Cons
- Steep learning curve because of its extensive set of features
- Limited integrations with third-party tools
4. Polymer
Polymer is another no-code analytics platform that focuses on helping you streamline the data visualization and reporting process. It also enables you to add readable data visualizations to your app or online domain using integrated analytics. Its user-friendly interface makes it very easy to combine data from multiple sources, such as Facebook Ads, Google Analytics, and Shopify, as well as synchronize them all for real-time insights.
Looking for a lightweight yet powerful tool? Polymer might be the perfect fit. It is best suited for marketing teams.
Key Features
- Polymer supports all major data connectors
- AI-powered insights via PolymerAI Chat
- Integrated Data Management
- Visual drag-and-drop builder feature for easy customization
Pros
- Beginner-friendly, intuitive interface
- Responsive support
- Has solid branding and template customization
Cons
- Has limited AI queries unless you’re subscribed to a premium plan
- Shopify integration is available; however, it may incur an additional fee, depending on your plan
- Complex initial setup
- Editor access is limited in lower plans
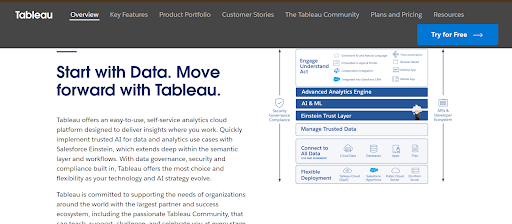
5. Tableau
Tableau is a popular no-code data analytics platform that enables the creation of interactive visualizations and dashboards. It features an incredibly easy-to-use suite and handles large data volumes more effectively than typical business intelligence tools.
Tableau is used by business executives, Data professionals, marketers, and salespeople. It remains a favorite for organizations with complex data needs, but it may be overwhelming for small businesses or solo users.
Key Features
- Drag-and-drop authoring turns fields into rich dashboards without a single line of code
- Hundreds of native connectors
- Visual prep, blending, and row-level security
- Data Management offering centralized governance
Pros
- Strong visualizations and embedded analytics
- It handles large data volumes effectively
- Quick insights without heavy setup
- Delivers professional executive reports
Cons
- Has a steep learning curve
- Not very flexible for a tailored workflow
6. Qlik
If you wish your data could tell you what you didn’t know to ask, you should probably check Qlik out. Qlik uses an associative data model that enables you to explore and analyze data in a manner similar to brainstorming, rather than following predefined paths or hierarchies, which facilitates the discovery of dynamic correlations between data points.
This platform is ideal for organizations and businesses seeking to maximize the value of their data for informed insights and informed decision-making.
Key Features
- Explore and analyze your data without following a predefined path
- Access control, user monitoring, and compliance features for secure access
- Handle larger data volumes and user needs even as businesses grow
- Connect to various data sources, whether on-premises or in the cloud
Pros
- It encourages deeper exploration
- Scalable for growing businesses
- Strong integration with data pipelines
Cons
- It's not the most intuitive for first-time users
- Enterprise plans are expensive
7. Domo
Domo is a cloud-based, AI-powered data analytics platform launched in 2010 as the first of its kind. It was founded with a mobile-first functionality to empower businesses to manage, analyze, and visualize data from anywhere. Domo provides end-to-end analytics capabilities, enabling organizations to make smarter, faster decisions in real-time.
Key Features
- Import .xls, .xlsx, or Zip files attached to an email message
- Bi-directional data flows into projects with pre-built and custom bi-directional connectors
- Drag-and-drop interface for visually designing and sequencing actions
Pros
- Great for C-level reporting
- Has strong data pipeline management
- Built-in automation tools
Cons
- Expensive for small businesses
- It can be overwhelming for first-time users
8. Metabase
Metabase delivers drag-and-drop exploration, natural-language querying, and enterprise-grade embedding in a single package. You can spin up the free OSS edition on your own hardware or let Metabase Cloud handle upgrades and backups, allowing business users to get dashboards and ad hoc answers without writing SQL.
Key Features and Benefits
- User-friendly interface that simplifies dashboard creation
- Customize visualizations to meet specific requirements
- Usage-analytics & auditing
Pros
- Metabase integrates with a broad range of databases
- Embedding & white-label options
- Hybrid hosting choices
Cons
- Advanced features sit behind Pro/Enterprise paywalls
- Self-hosting demands DevOps resources
Comparing the Options
Key Features to Look for in a No-Code Analytics Platform
As you compare no-code analytics tools, focus on features that let your team move from raw data to clear decisions with as little friction as possible. Fancy charts and sleek dashboards alone don't get the job done; what matters is the tool that helps you and your team achieve your goals without hassle. Here is a list of top features you should look out for:
1. Interactive analytics (AI chat interface): The ability to ask questions in plain English and receive instant insights is a crucial feature that saves a significant amount of time for both technical and non-technical individuals. Look for platforms like BlazeSQL that enable you to interact with your data.
2. Team collaboration: Prioritize accessibility. Everyone on your team should be able to access insights, comment, or even build their reports within a shared collaborative space. The easier it is to collaborate on a project, the faster you will reach your business goal.
3. Security & access controls: Role-based access and data permissions should be a let feature, primarily if you work with a large team.
4. Seamless data connections: Connecting data to these platforms should be hassle-free, so that everyone, including business users, can connect data in just a few clicks.
5. Good visual dashboards: The best platform should enable you to create visuals that are easy to understand and inform your decisions.
How to Choose the Right Platform for Your Team
Selecting a no-code analytics tool isn’t about picking the flashiest features; it’s about matching the platform’s strengths to your team’s data skills, workflows, and growth plans. Use the framework below to weigh ease of use, data source compatibility, security needs, and total cost of ownership before committing.
1. Who will use it?
Is it just the data analysts who need access, or will the sales, marketing, and operations teams also require access? Here, consider something intuitive enough for everyone, not just the tech-savvy.
2. What problem does the platform solve?
Clarify the primary pain-point, whether it’s automating KPI dashboards, enabling ad hoc self-service queries, consolidating scattered data sources, or forecasting trends. Choose the tool whose core strengths directly tackle your business challenge, so you avoid extra cost and unused features.
3. Do you have existing tools that need to be integrated with the platform?
For example, if your data is stored on Airtable, Shopify, or an SQL database, choose a tool that can easily integrate with your existing data source.
4. What’s your budget?
Tools range from free to enterprise-level pricing. Look beyond just the base cost, consider other features like user limits, support, and scalability.
BlazeSQL: The Ultimate No-Code Data Analytics Platform
BlazeSQL turns natural-language questions into optimized SQL, runs queries across Snowflake, Redshift, BigQuery, and SQL databases, then returns output as a table, visuals, or code (depending on your questions), all from a single chat window. Business users gain self-service insights in minutes, while analysts reclaim hours previously spent on ad hoc requests. The platform’s friction-free setup and AI-driven 'Personal Data Analyst' experience make it a standout among 2025’s no-code tools.
Unlike many cloud-first BI suites, BlazeSQL prioritizes privacy: its desktop app stores row-level data on-premises, sending only table and column names to the AI. A 300-table cap per connection encourages teams to focus on relevant data, boosting performance, while role-based controls and encrypted direct links meet enterprise security audits. Coupled with a drag-and-drop dashboard builder and a one-click report generator, BlazeSQL enables any stakeholder to go from question to shareable chart without writing code.
What truly sets BlazeSQL apart is its adaptive engine: it reads your table schema, absorbs any business context you add to its knowledge base, and continuously refines the output quality for your business content.
Speed and simplicity don’t come at the expense of depth. Power users can refine AI-written SQL, add Python snippets for advanced modeling, and schedule email insights. Trusted by teams at Amazon, Siemens, and eBay, BlazeSQL is quickly becoming the go-to platform for companies seeking enterprise-grade analytics with the ease of a consumer-grade experience.
Unlock instant data insights with one click
Frequently Asked Questions
What is a no-code data analytics platform? No-code analytics platform is a tool that enables users to analyze and derive insights from their data without writing any code. These tools can be used by anyone regardless of their level of technical expertise. They offer drag-and-drop interfaces, AI-powered suggestions, and easy data connectors to analyze and report data faster.
How does a no-code platform differ from traditional BI or low-code platforms? Most traditional BI tools often require a certain level of technical skills or developer support for set-up and maintenance. Low-code platforms reduce the effort but still involve some technical knowledge. However, no-code tools eliminate the need for code entirely, making data analysis truly accessible to anyone.
What are some benefits of a no-code analytics platform? No-code analytics tools eliminate technical barriers, providing every team member faster access to data-driven decisions.
- Speed: Ask your data questions and get insights in minutes.
- Accessibility: Teams don't need data analysts to run reports. It is accessible to team members.
- Collaboration: Share dashboards and insights easily.
- Cost-effective: Reduces reliance on dev teams and analysts.
- AI-powered: Many of these platforms now offer AI features for smart analysis, reporting, and forecasting.
Are no-code platforms like those mentioned above secure? Yes, most top no-code analytics platforms prioritize security. They typically offer features such as encrypted data connections, role-based access control, Single Sign-On (SSO), and compliance with standards like the GDPR or SOC 2. That said, it's always best to review each platform’s specific security policies and accept them based on your business policies or needs.