


What Is a SQL Dashboard & How to Create One?
A SQL dashboard is an interactive business-intelligence interface built on SQL queries that surfaces real-time metrics from relational databases such as Snowflake, BigQuery, or MySQL. These dashboards play a crucial role in clearly communicating insights across teams within or outside a business. By converting raw data into dynamic charts, trendlines, tables, and comprehensive reports, SQL dashboards enable users to uncover trends, monitor performance in real-time, and illuminate the underlying relationships within their data.
Since this raw data typically resides in SQL databases—the standard way most companies store their information—dashboards become essential tools for unlocking it. While SQL databases are rich in structured knowledge, that information is often inaccessible to those who can't write queries. Dashboards bridge this gap by turning data into intuitive insights that anyone can explore, understand, and act on.
In this article, we’ll take a deep dive into SQL dashboards. We will cover what they are, who benefits from them, how AI has transformed SQL dashboard creation, and how to create one using BlazeSQL.
Stakeholders That Benefit From SQL Dashboards and How They Use Them
SQL dashboards are a cornerstone of modern business intelligence, empowering stakeholders with real-time, data-driven insights without the need for complex tools or manual data crunching. With solutions like BlazeSQL, teams can access insights through intuitive dashboards built from SQL queries, enabling faster decision-making and enhanced collaboration across departments.
Here’s how various stakeholders benefit from using SQL dashboards:
Executives and Founders
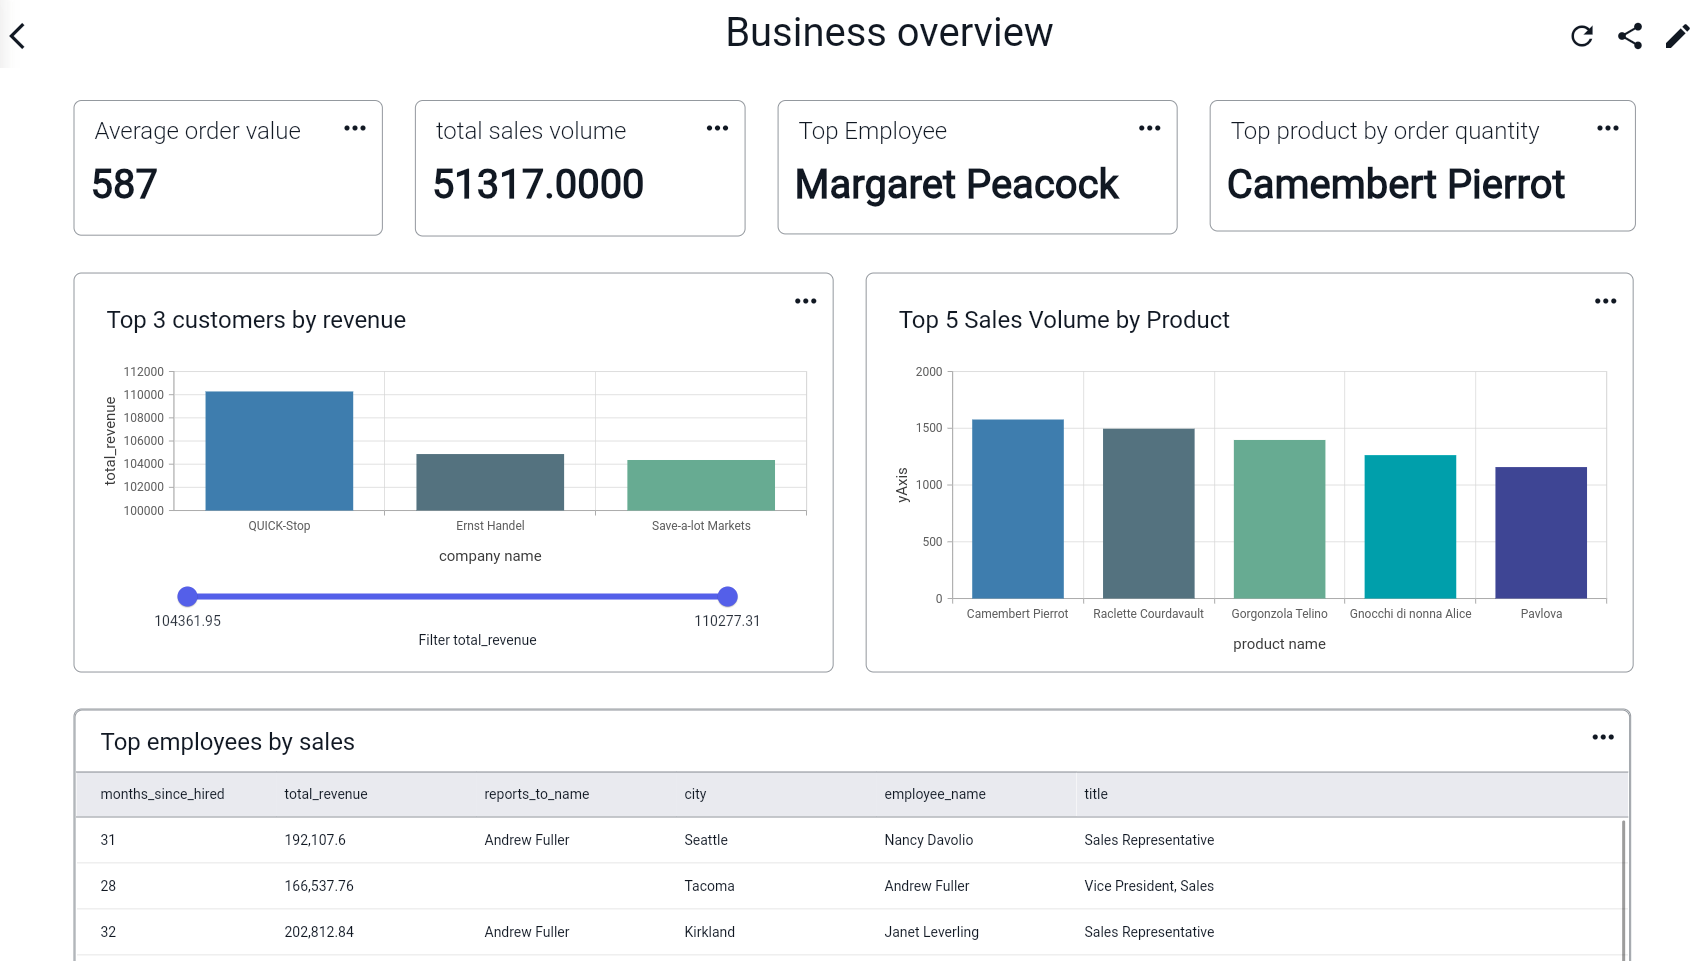
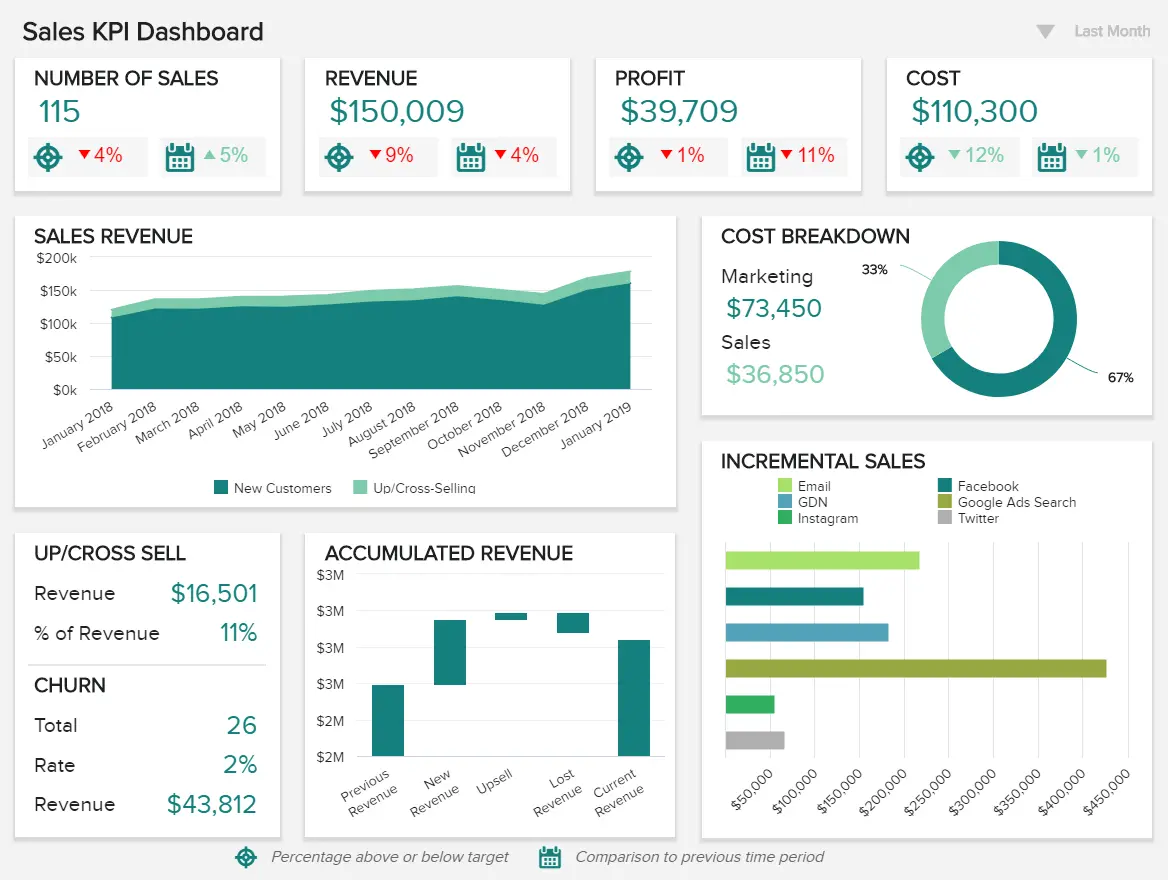
Executives need high-level visibility to make quick, informed decisions. SQL dashboards provide instant access to critical metrics, such as revenue, expenses, profit margins, and growth trends, eliminating the need to dig through spreadsheets or wait for reports. For example, a CEO can instantly compare costs to revenue over the last quarter to understand their financial health and make strategic decisions with confidence.
Marketing Teams
Marketing teams rely on SQL dashboards to consolidate campaign data and performance metrics in a single location. Instead of pulling separate reports, dashboards can display live data on website traffic, lead volume, conversion rates, CPA, ROI, and more. This unified view enables teams to monitor campaign effectiveness in real-time, align efforts across the entire funnel, and pivot quickly when necessary.
Sales Managers
Sales dashboards enable sales leaders to stay on top of team performance. With a glance, they can track key metrics, including open deals, win rates, average deal size, sales across different channels, and quota attainment. Rather than waiting for weekly updates, managers have access to up-to-date insights that help them coach reps, forecast more accurately, and hit targets consistently.
Finance Teams
SQL dashboards give finance professionals visibility into real-time financial data across multiple locations or departments. From tracking daily cash flow and identifying expense anomalies to monitoring budget variance and return on investment (ROI), dashboards enable analysts to pinpoint issues and take corrective action quickly. For example, a dashboard that shows expenses versus revenue by store can instantly highlight underperforming locations.
Operations and Inventory
Operational efficiency depends on real-time visibility, and SQL dashboards deliver just that. Inventory levels, order fulfillment rates, shrinkage, and stock health can all be monitored through a single interface. A dashboard displaying inventory versus reorder points across SKUs with color-coded alerts enables managers to prevent stock-outs or overstocking before they become costly problems.
Product Managers
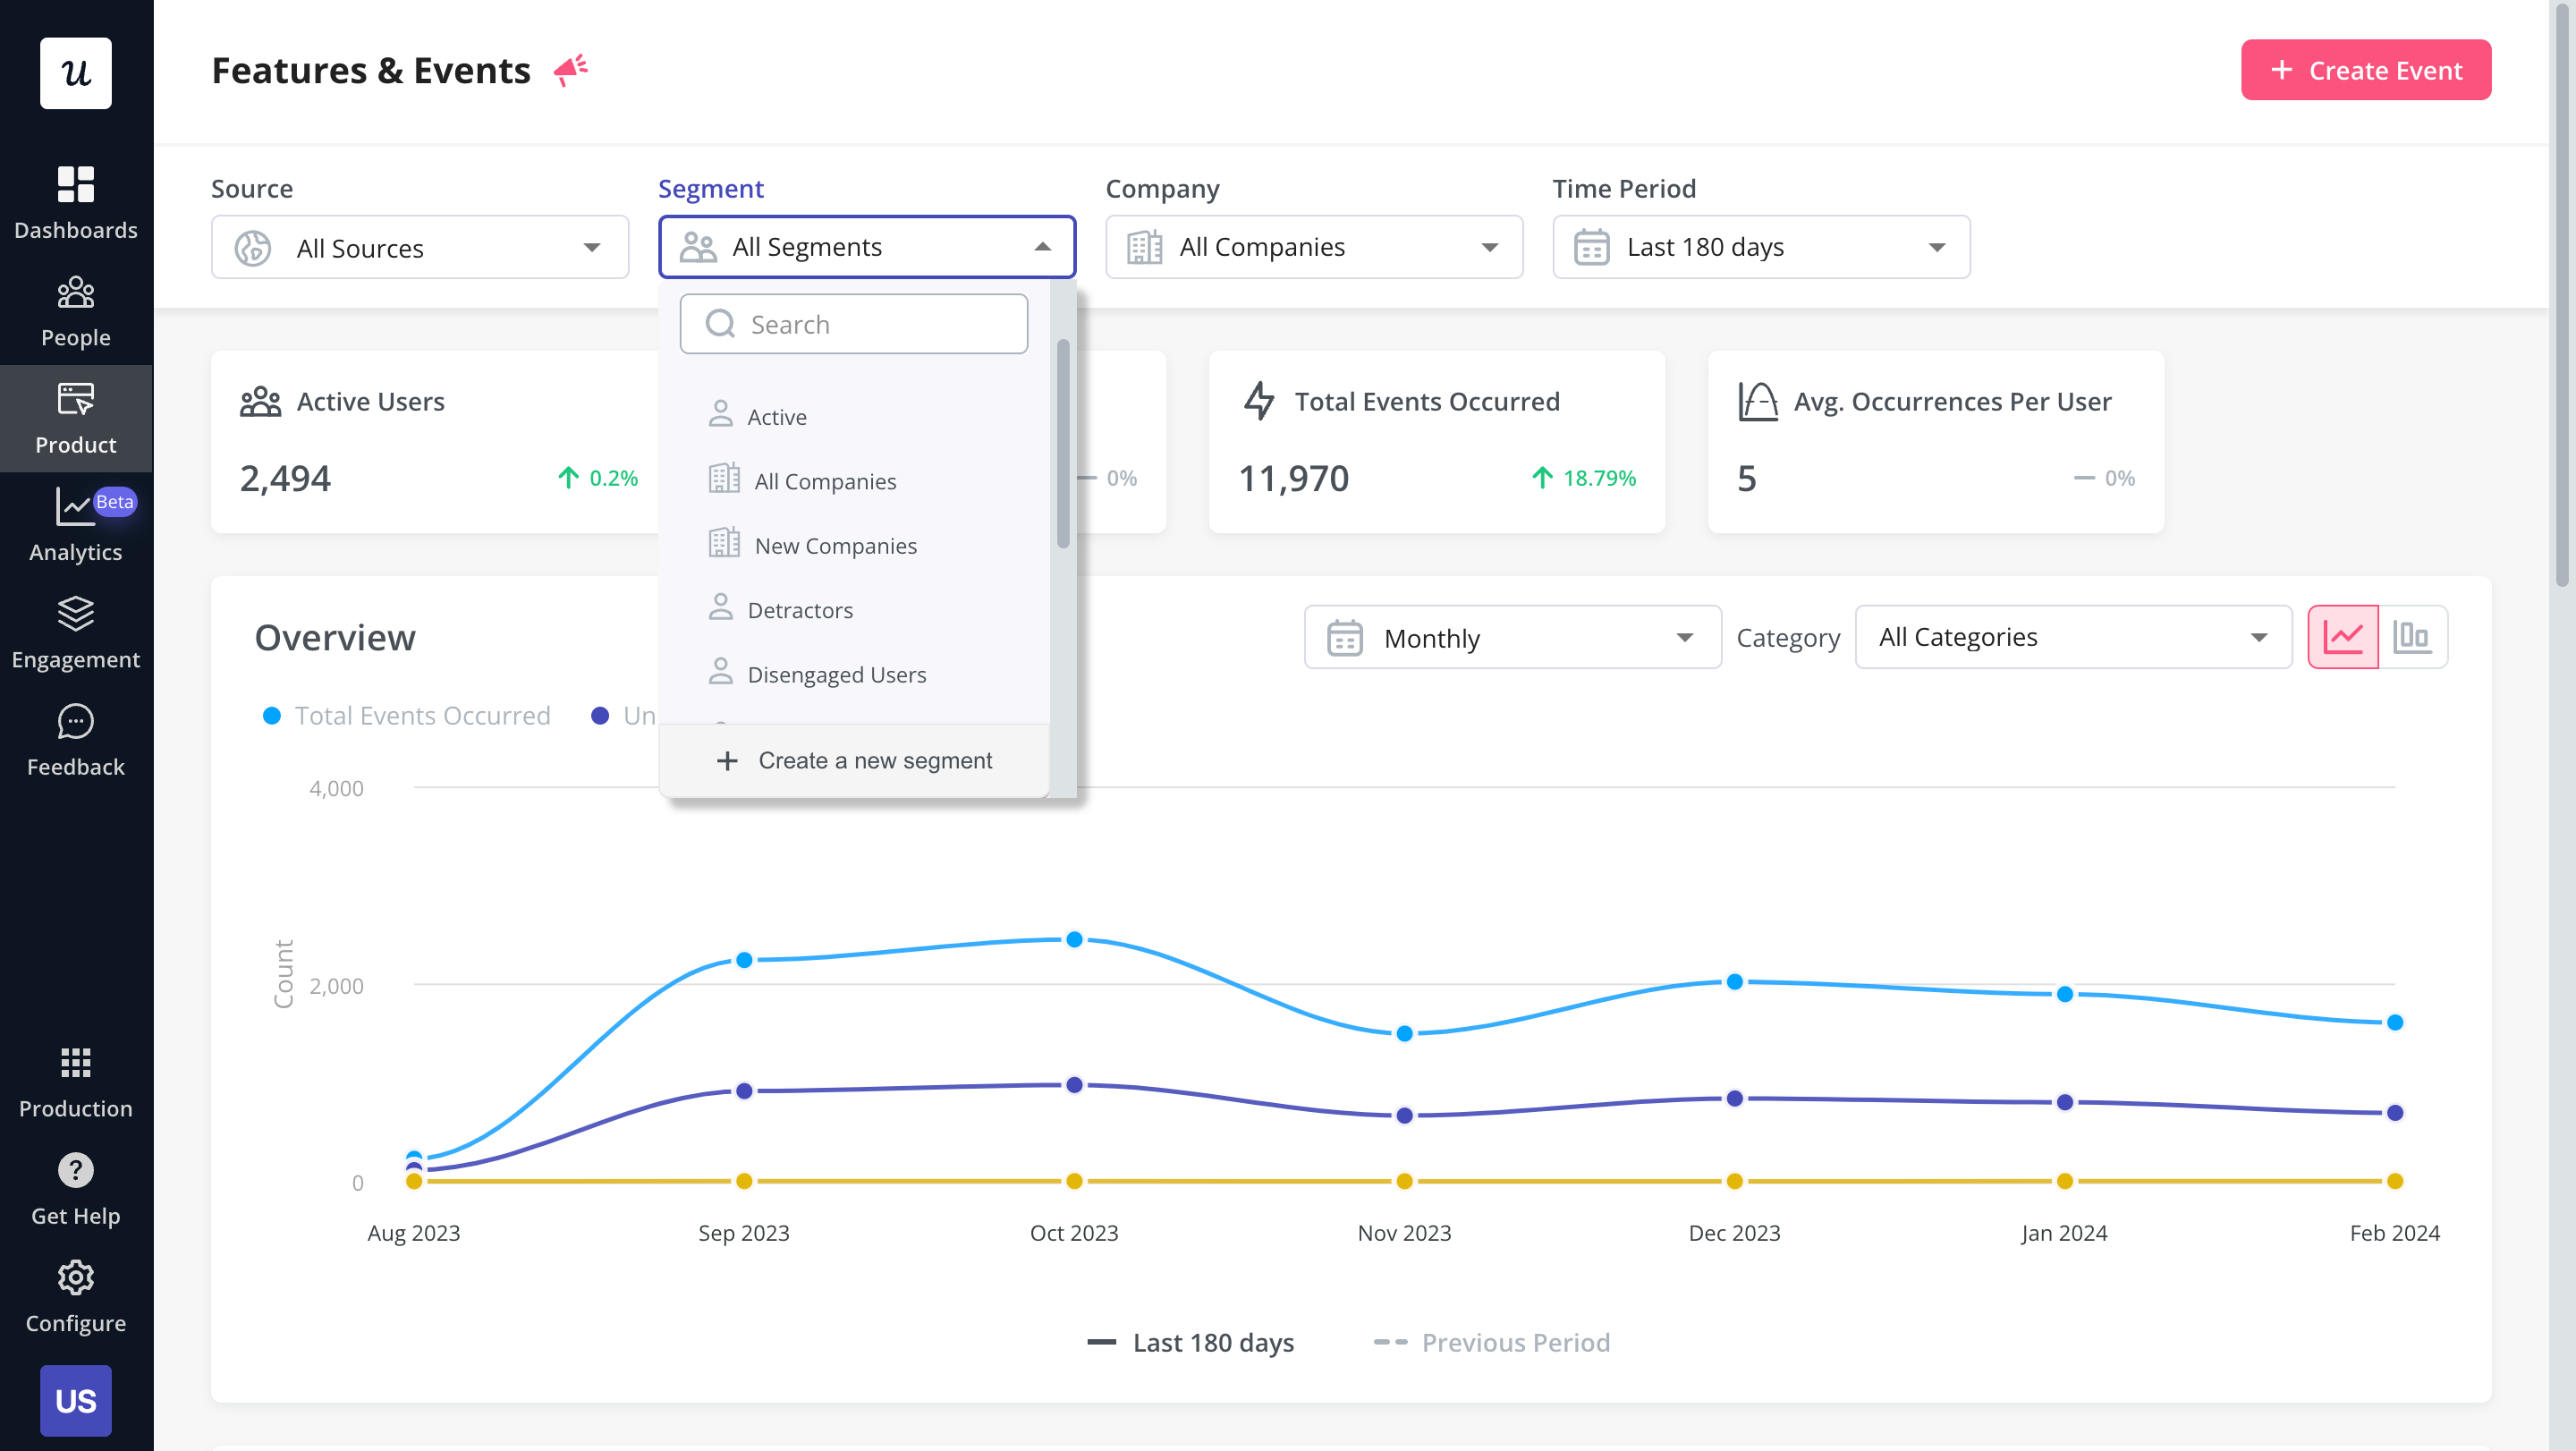
Product managers are interested in how users interact with the products they build. As such, they use dashboards to highlight key metrics, such as active users, user drop-offs, session durations, and many more, to uncover opportunities for building better experiences. SQL dashboards can help track engagement across key product features, giving insights into what’s working and what needs attention.
SQL Dashboards in the Age of AI
Before the introduction of AI into business intelligence systems, organizations had to wait long periods for IT teams to create custom dashboards. A survey by ActivTrak revealed that over two-thirds of executives feel uncomfortable using business data themselves, and over 70% believe that data skills are too hard to learn.
With AI now in play, both executives and non-technical teams such as marketing, HR, finance, and operations can create intuitive dashboards in seconds, access real-time insights without relying on IT teams, and make informed decisions at a speed previously unattainable. Here are some ways AI tools like BlazeSQL have made creating a SQL dashboard very easy:
AI Understands Your Question and Pulls the Right Data
AI tools now interpret natural language and automatically convert it into SQL queries. So when a user asks, “What’s our best-performing ad from the last quarter?”, the AI identifies relevant tables, joins, and filters, then pulls the correct data from the database instantly. This eliminates the need to understand complex schemas or write code, closing the technical gap between business users and data.
Selects the Best Way to Visualize the Data
After running the query, AI doesn't just show you rows and columns; it also chooses the most meaningful way to present that data—a ranked bar chart, a time-series line, or a heat-map comparison. Users not only access data, but also gain immediate insight from it.
Anyone Can Build Dashboards—No Technical Skills Required
By removing the need to write queries or design visualizations from scratch, AI democratizes dashboard creation. Anyone on your team can explore data, answer business questions, and build dashboards using everyday language. This reduces the bottleneck around IT and analytics teams and encourages a more data-driven culture across departments.
SQL Dashboards Are Always Live and Instantly Actionable
Because AI-powered tools like BlazeSQL connect directly to live data sources, dashboards update in real-time. Whether tracking customer churn, inventory levels, or ad performance, colleagues can act on the most current data. No more waiting for outdated reports or manual refreshes.
How to Create Your Own SQL Dashboard with BlazeSQL
BlazeSQL is the holy grail for non-tech users who need to build SQL dashboards. If you’ve never written a single line of code, here’s how to build one with BlazeSQL in three steps:
1. Connect to Your Database
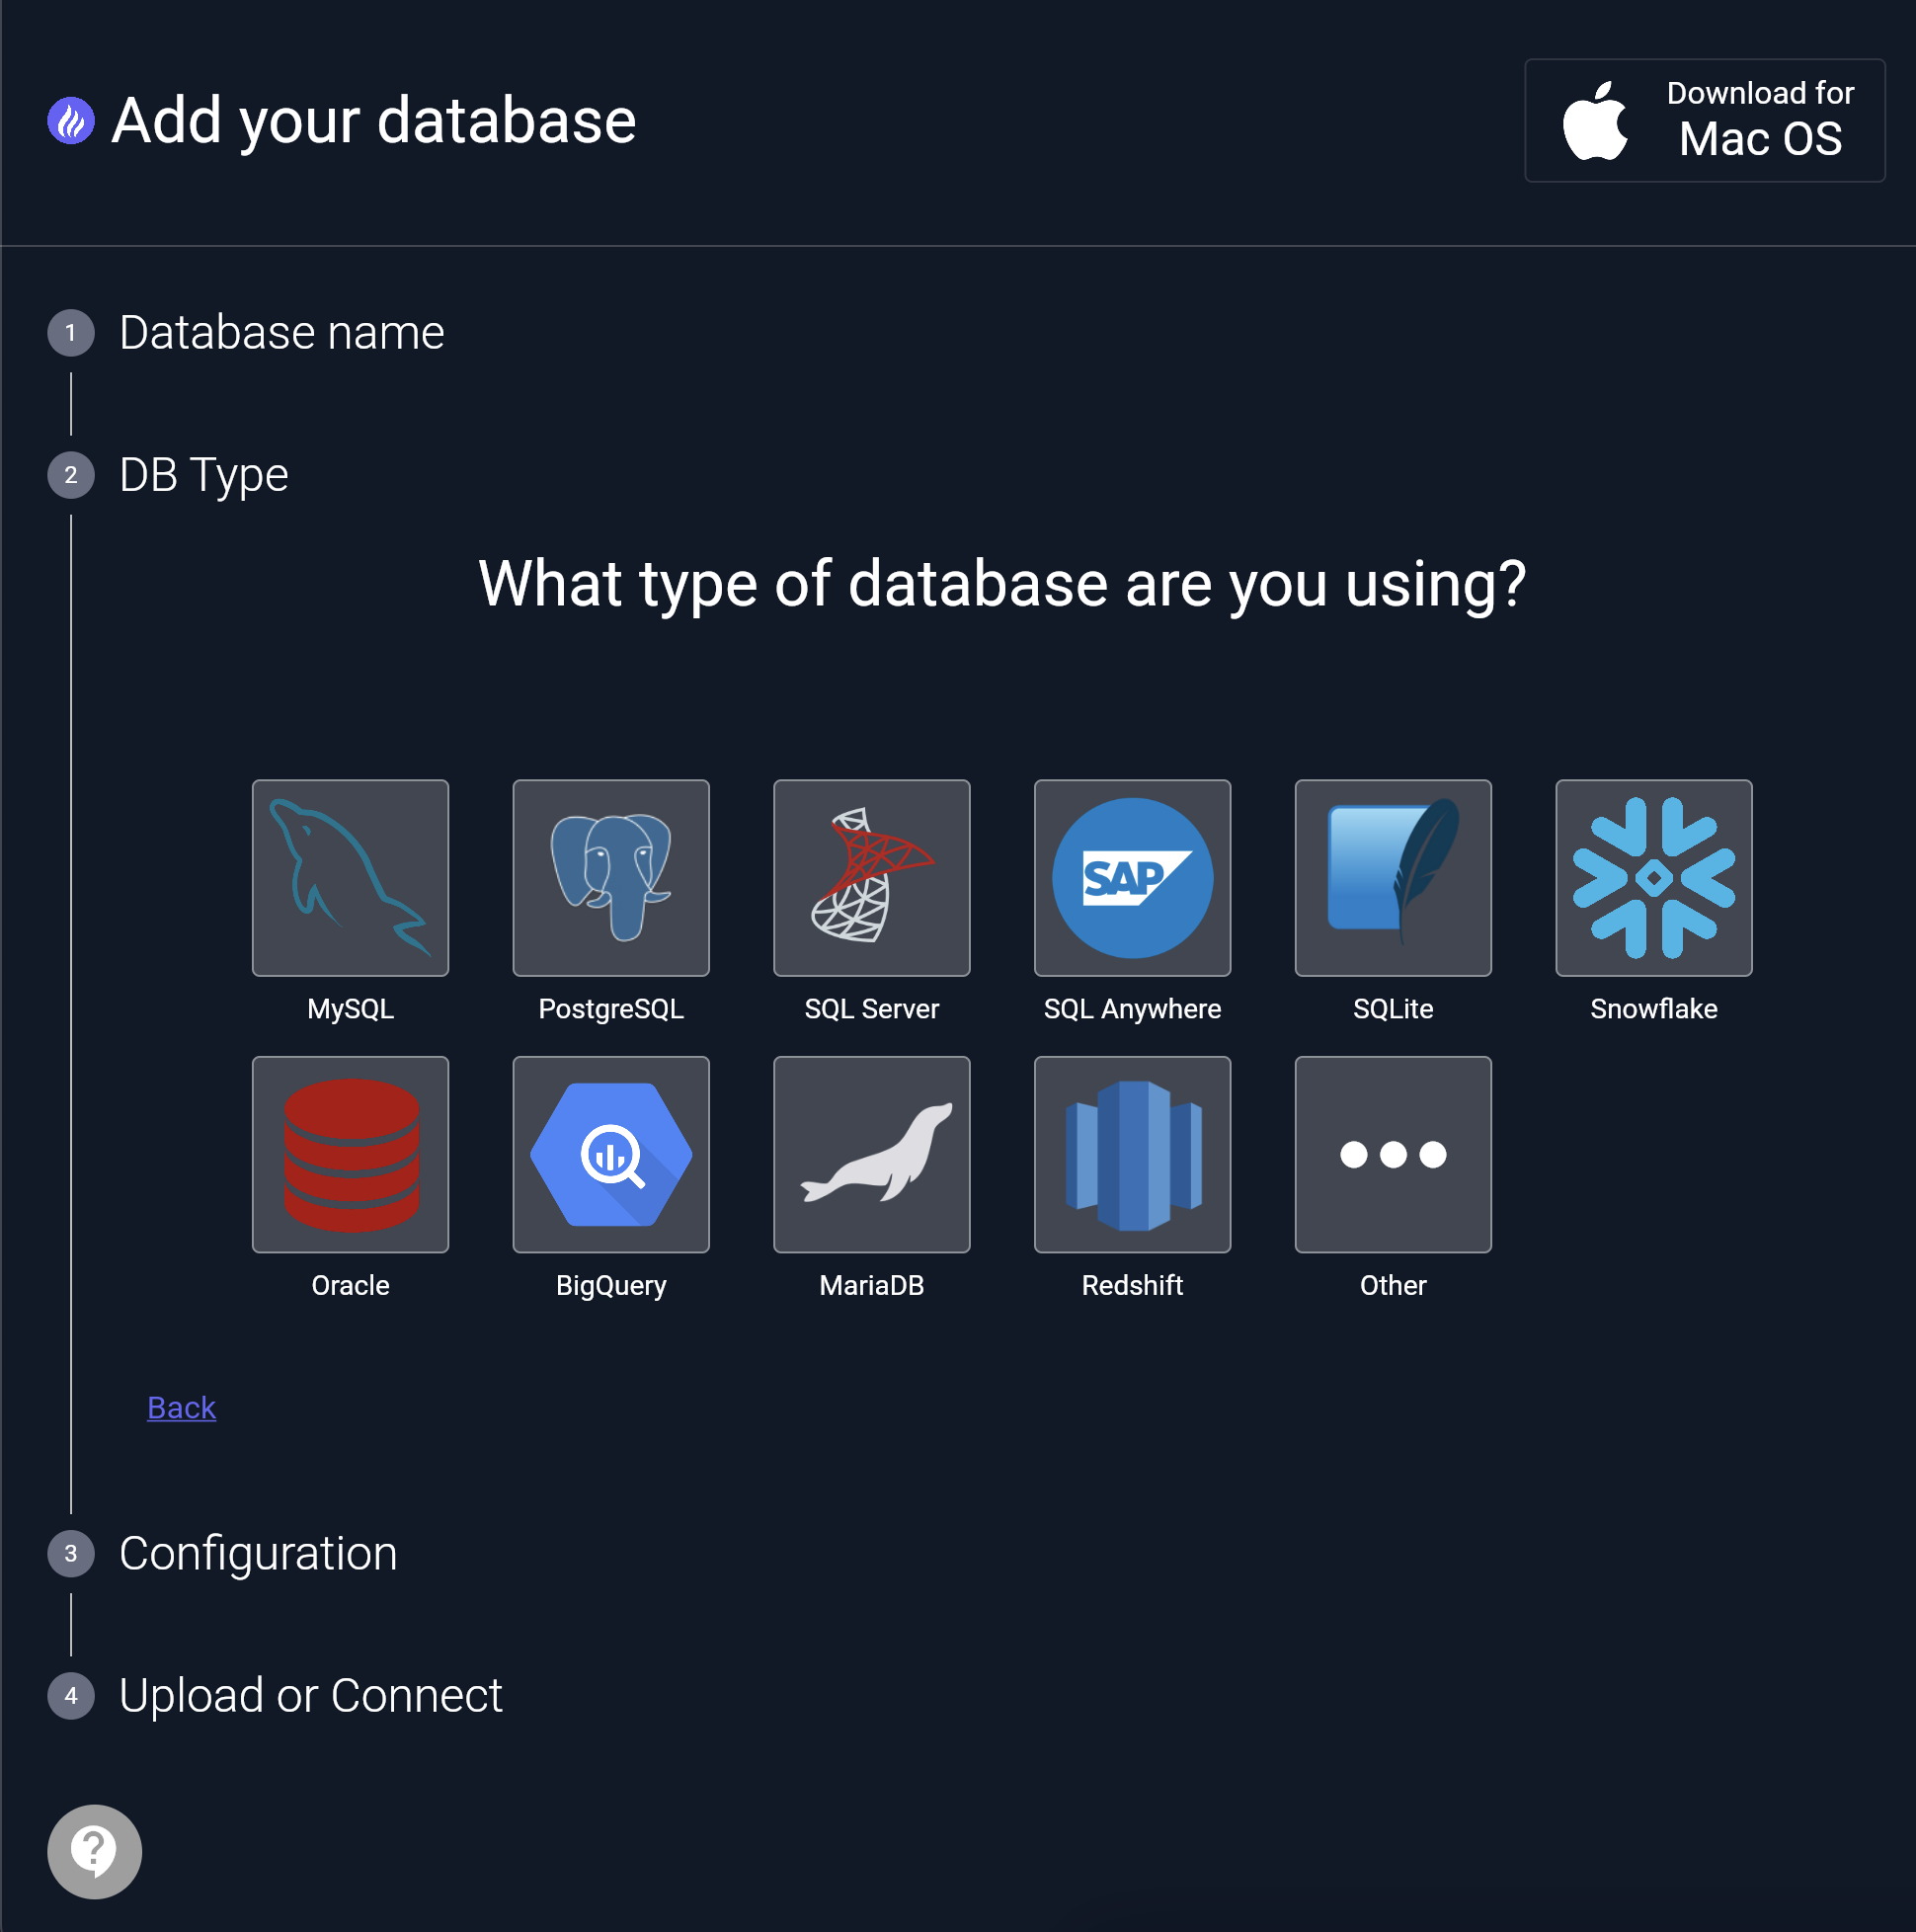
BlazeSQL can connect SQL databases, including BigQuery, Snowflake, Redshift, MySQL, PostgreSQL, SQL Server, among others. The first step is to connect to your database once, and it remains connected.
2. Tell the Chatbot What Visualizations You Want
Now that your database is connected, you can query the database using plain English. For example, you could ask, “How much was spent on ads in the last 3 months?” and it will generate a visualization for you. Or, if you have pre-saved queries, you can use them and create a visualization.
3. Build Your Dashboard
If you like the chart generated by the AI, you can click the three dots at the top-right corner to add it directly to a new or existing dashboard. You can repeat this process with different queries to build a custom dashboard that highlights the relevant visuals and insights for your stakeholders.
Key Considerations When Creating Your Own SQL Dashboard
While AI tools make dashboard creation faster and more accessible, building an effective dashboard still requires thoughtful planning. Here are some key considerations to ensure your dashboard is not only functional but also valuable to your stakeholders:
1. Know Your Audience
Before building, ask: Who is this dashboard for? Whether it’s executives, marketers, or product managers, the dashboard should align with their goals and decision-making needs. Tailor your data, visuals, and language to the audience's level of expertise and business focus.
2. Define Clear Objectives
Every dashboard should answer specific questions. Are you tracking growth? Monitoring campaign performance? Detecting anomalies? Knowing the purpose helps eliminate unnecessary data and keeps the dashboard focused and actionable.
3. Prioritize Key Metrics
Avoid clutter. Highlight the metrics that matter most, don’t overcrowd the interface. A clean, prioritized layout helps stakeholders find insights faster.
4. Design for Clarity, Not Just Looks
While visuals matter, clarity is king. Use the right chart types for your data, add labels and legends, and avoid overusing colors. AI may recommend chart types, but you should always sense-check for interpretability.
5. Make It Interactive
Add filters, date pickers, or drill-down options where appropriate. This gives users the flexibility to explore the data further without creating new views.
Try our SQL Dashboard Generator for Free.
Are you an executive or non-technical user? BlazeSQL helps you build AI-powered dashboards without coding. Our AI-powered tool allows businesses to gain insights faster, reduces the time spent on manual reporting, and empowers non-technical teams to make more informed decisions.
Start your 7-day free trial today and see how easy it is to build a SQL dashboard that works for your business.