


What Is Self-service Analytics?
Self-service analytics is a type of business intelligence (BI) that enables colleagues or users, without technical expertise, to access, analyze, and visualize data independently. It provides teams with direct access to insights, enabling them to make faster and smarter decisions.
Have you ever needed an answer from your data and had to wait days for a report from IT? I bet. Slow access to insights remains one of the significant barriers to making data-driven decisions, which in turn impacts business outcomes. Companies that make data-driven decisions quickly are 23 times more likely to outperform competitors in customer acquisition.
To facilitate fast data-rich decisions, self-service analytics puts data directly into the hands of those who need it. Business teams can run queries, spot trends, and take action without being blocked by technical steps.
In this article, we’ll take you through the ins and outs of self-service analytics, explaining how it works, how AI is changing the game, what tools to consider, and how to roll it out across your organization. Fast insights are no longer optional; they are how winning teams operate.
How Does Traditional Self-service Analytics Work?
Traditional self-service analytics runs on structured workflows behind the scenes. Data engineers build pipelines that extract information from various sources and consolidate it into a single, central platform, such as a warehouse or database. They clean, organize, and prep the data so it is ready for business users.
Once the system is in place, users can create dashboards, reports, and models using a simple drag-and-drop interface. Tools like Tableau and Power BI lead the way in this area.
The real win was that users no longer had to wait for IT to run queries. They could explore the data themselves. However, to achieve substantial value, users still required some technical skills, such as understanding data joins, building reports, or writing basic SQL queries, which limited the widespread adoption of self-service analytics.
The Introduction of AI and Its Impact
AI is upending the traditional self-service model. Today, AI and machine learning platforms can auto-generate queries, detect trends, and even provide recommendations for insights. These AI-powered tools remove a major barrier for non-technical users.
Tools like BlazeSQL are a perfect example of this shift. With AI at their core, these tools enable self-service analytics to be faster, more intuitive, and significantly more powerful. It simplifies complex analysis, allowing teams to go from question to insight in minutes rather than hours.
Brady Caspar, CTO at hoo.be, explains,
"Blaze saves our team hours of manual work each week by automating the process of writing the queries we use to analyze our business. It unlocks a new level of analysis, filling in our SQL knowledge gaps and writing complex queries that enable us to dig deeper into our data than ever before."
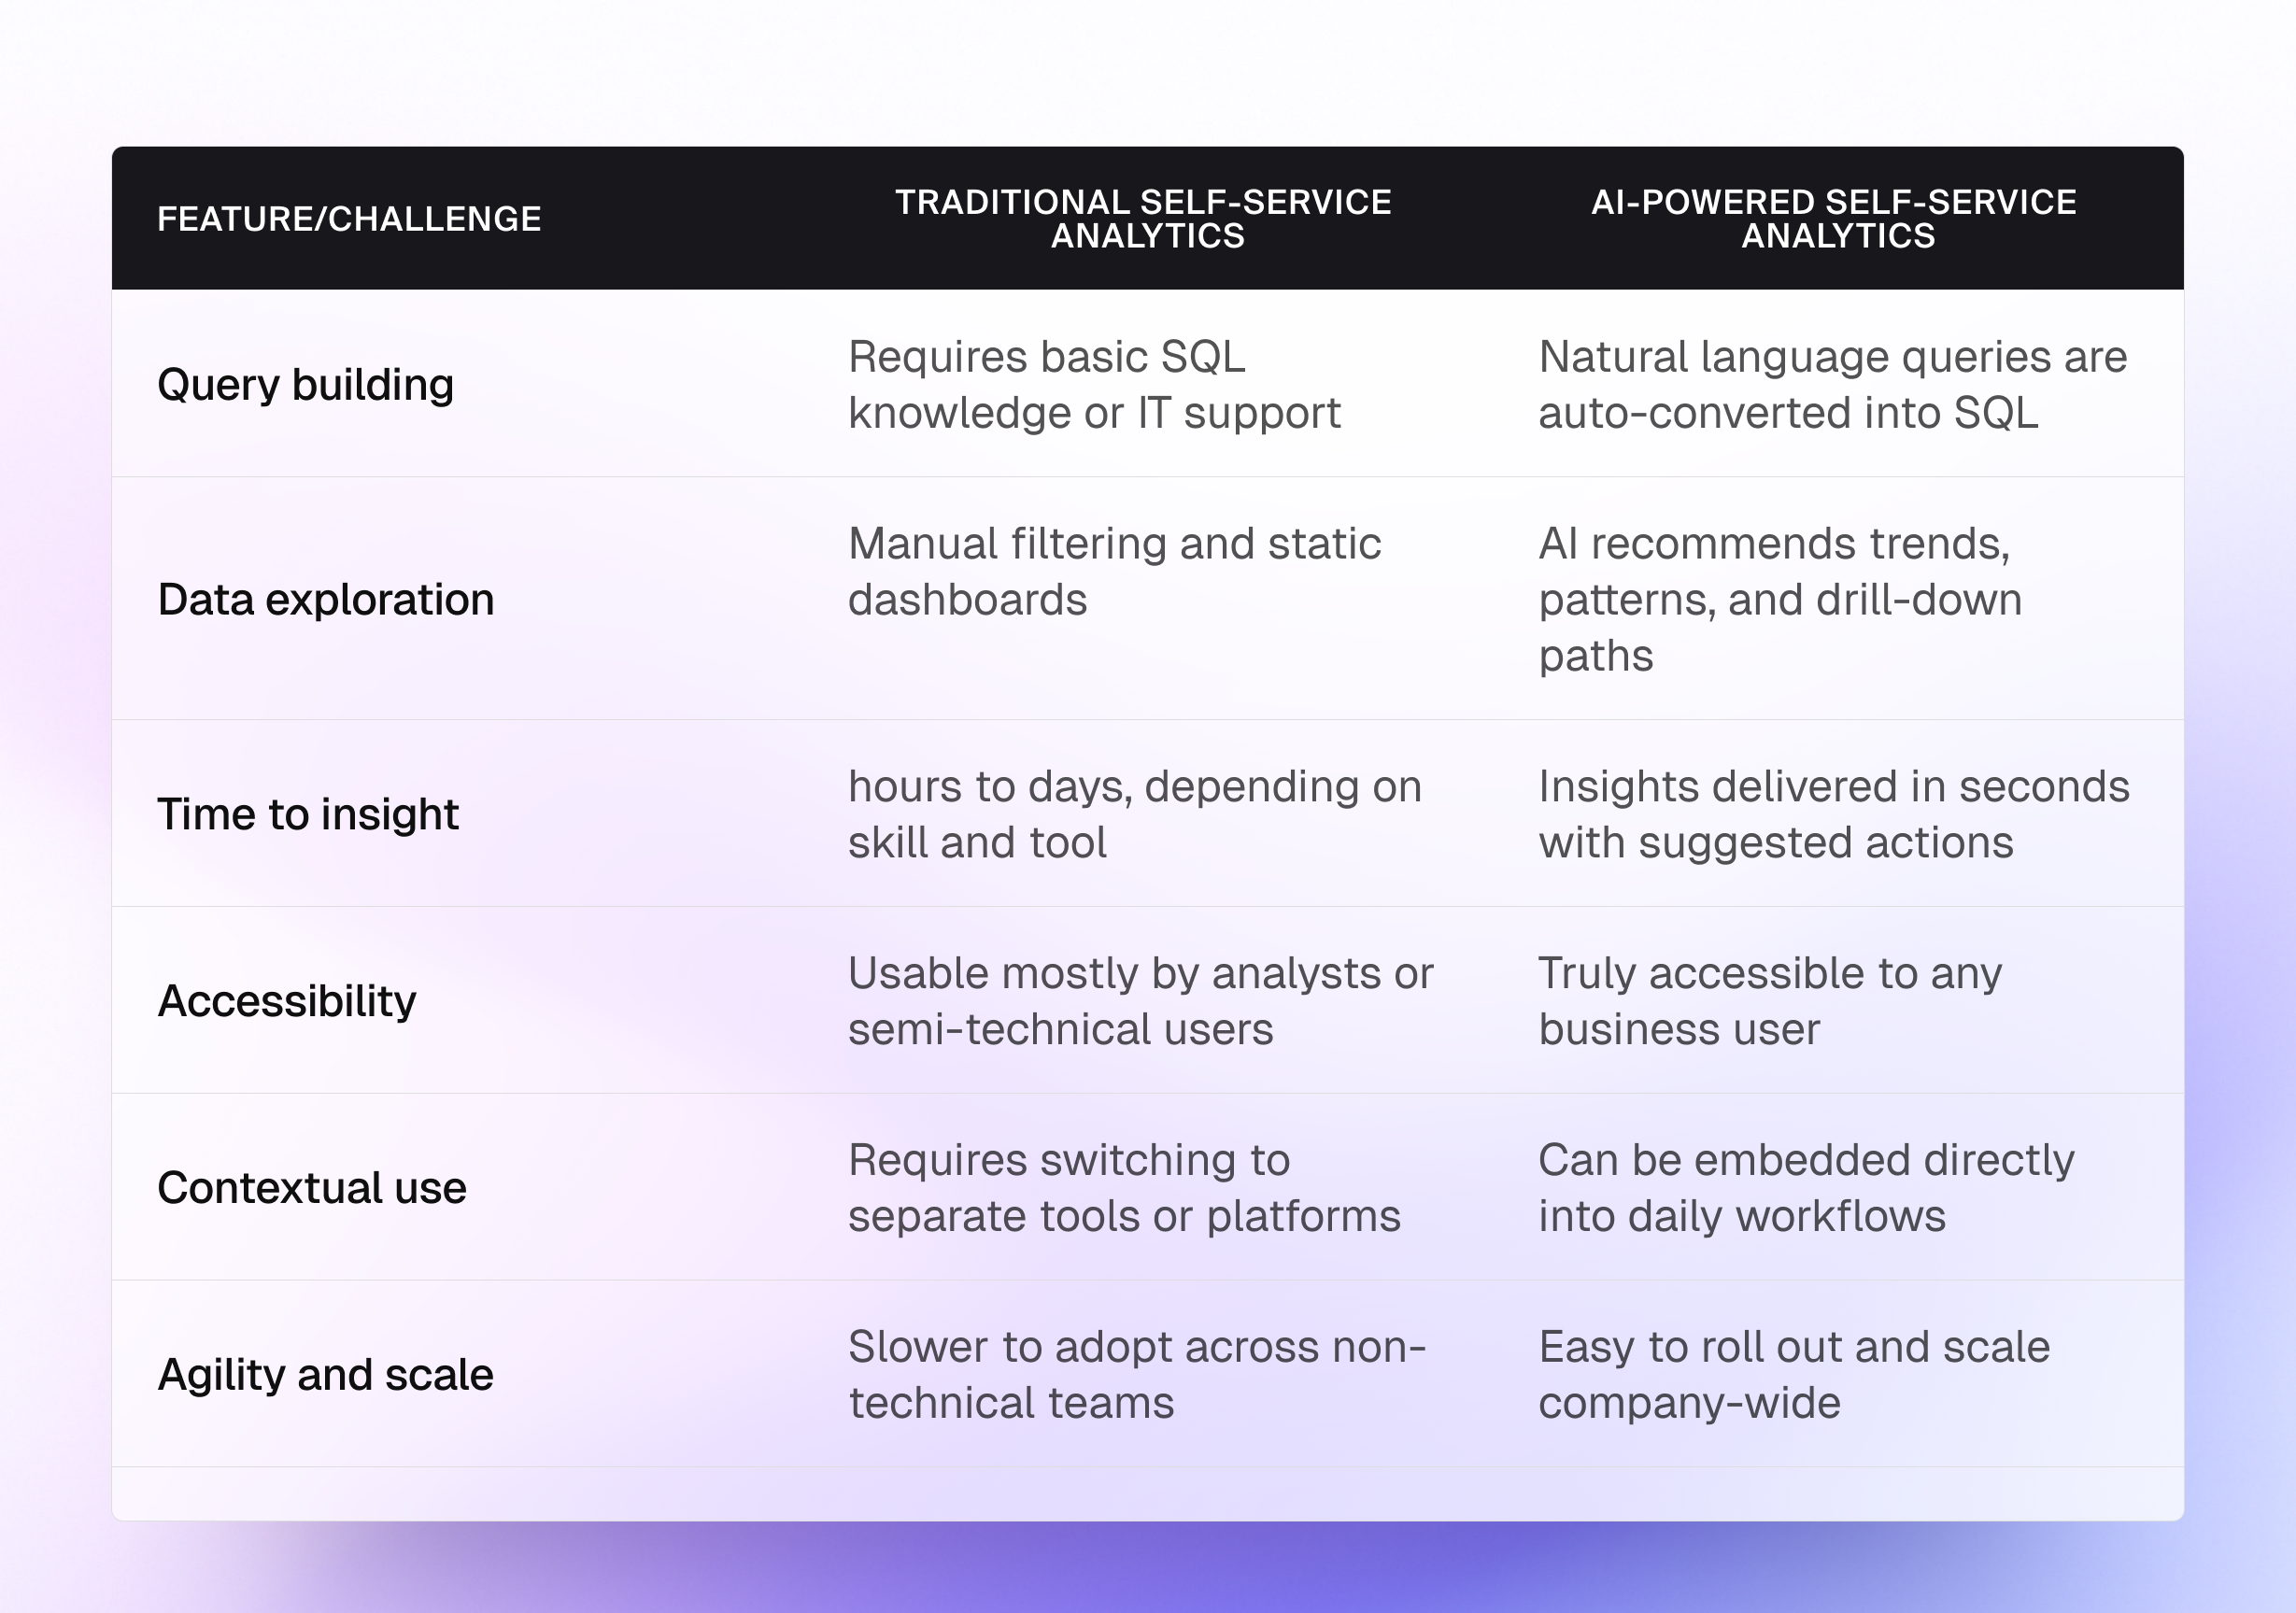
Here’s how traditional self-service analytics compares to AI-powered self-service analytics:
Key Applications of Self-service Analytics Across Various Industries and Stakeholders
Self-service analytics is not just for the executive suite. It is becoming essential across departments and industries.
Here is how different stakeholders are using it:
- Management: Executives use self-service analytics for strategic planning. They rely on real-time dashboards that show KPIs, customer trends, and operational metrics, which help them react faster to market changes.
- Data analysts: Instead of spending time on basic reports, analysts can now focus on complex modeling, predictive analytics, and strategic advising. They work smarter, not harder.
- Sales and marketing teams: Teams pull their lead-gen reports, customer engagement stats, or campaign performance numbers without submitting endless data requests. They iterate campaigns much faster.
- Operations and logistics: Supply chain managers instantly track inventory movement, delivery times, and vendor performance. This allows them to fix bottlenecks before they snowball.
- Customer service teams: By accessing customer feedback data, service teams can identify product issues or satisfaction trends early and take prompt action to address them.
Across industries, the impact is enormous:
- CPG and Retail: Brands analyze shopper behavior and optimize stock levels at the store level to enhance customer experience.
- Pharma and Life Sciences: Researchers and product teams track clinical trial data, operational performance, and sales metrics in real time.
- Financial Services: Banks and insurers monitor transaction trends, risk factors, and customer engagement without waiting for quarterly reports.
- Logistics: Transportation companies use analytics to optimize routes, monitor fleet performance, and manage supply chains with agility.
Sej Sander Thorsen, Chief Product Officer at Klarpris, captures it well: "With BlazeSQL, we have gotten a fast track to data-driven insights. Blaze enables us to understand our customers better and make data-driven decisions. We can quickly test a hypothesis, without involving engineering."
The Organizational Benefits of Self-service Analytics
Self-service analytics speeds up organizational performance by eliminating the delays between asking a question and getting an answer. It’s no longer just about access to data; it's about enabling smarter, faster decisions that outpace the competition. Here are the tangible benefits organizations are seeing today.
Increased Agility in Decision Making
Your business moves at a snail's pace when every decision relies on someone else pulling data. With self-service analytics, leaders and frontline teams can ask a question, get the answer, and act immediately.
Instead of endless meetings and back-and-forth, teams test ideas, spot risks, and seize opportunities while they are still hot. This agility can be the difference between gaining and losing market share.
Reduce Dependence on IT and Data Science Teams
Traditional analytics models often create a persistent bottleneck. When business users need a report, they must request it from the IT department. IT then queues and prioritizes the request. By the time the report is delivered—often days or even weeks later—the business need may have changed or the opportunity may have passed.
Self-service analytics flips that script. Now, sales, marketing, product, and operations teams can run their reports, perform their analysis, and take ownership of their insights.
It does not mean data teams disappear. Instead, it frees them up to work on high-impact projects like machine learning models, data governance, or strategic data initiatives. Everyone works smarter.
More Cross-team Collaboration
When different departments can access the same data, work with it easily, and share insights quickly, collaboration skyrockets.
Sales and marketing can align campaigns faster. Product and customer success teams can collaborate to identify churn risks. Finance and operations can run real-time budgeting exercises without silos or guesswork.
Instead of every team living in isolation, self-service analytics creates a common language of data across the organization.
It also means better alignment. Everyone is operating from the same playbook. No more "my numbers versus your numbers." Just one version of the truth.
A Data-first Culture
Data does not lie. It shines a light on what is working and what is not. When data becomes available to everyone, decision-making naturally becomes more evidence-based. Teams stop relying on gut feelings or political battles. They use real numbers to back up their strategies.
This shift to a data-first culture drives better outcomes across the board. Companies that live and breathe data do not just react faster. They innovate smarter, predict trends earlier, and build more resilient businesses.
Self-service analytics acts like a gateway drug for this cultural shift. It moves data from being something mysterious that only the "experts" touch to being part of everyone's daily workflow.
Various Challenges and How to Overcome Them
Of course, no system is perfect. There are real challenges organizations must face when rolling out self-service analytics. Here are the key challenges and how innovative companies are addressing them.
Low Data Literacy Among Employees
Handing someone a powerful tool is not helpful if they do not know how to use it. Many employees are unfamiliar with basic concepts, such as filtering data, building visualizations, or interpreting trends.
Solution: Invest in ongoing training programs. Make data literacy part of onboarding, leadership development, and everyday workflows. Keep it practical and hands-on. Real business examples beat theory every time.
Data Governance Risks
The more people have access to data, the bigger the risk of misuse, leaks, or inconsistencies.
Solution: Implement robust role-based access controls. Only give access to what someone truly needs. Monitor usage patterns and conduct regular audits to ensure optimal performance. Additionally, establish clear documentation and policies regarding data handling.
Poor User Adoption
Some employees will resist change. They prefer asking for a report rather than learning a new system.
Solution: Pick tools that are genuinely easy to use. Prioritize intuitive interfaces over flashy features. Start small with pilot teams, showcase quick wins, and let peer influence drive adoption.
Fragmentation of Data Sources
If every team pulls from different data sets, chaos follows. Inconsistent numbers lead to finger-pointing and poor decisions.
Solution: Centralize your data architecture first. Build or buy strong data pipelines that feed a unified source of truth. Ensure that all analytics tools draw from the same source.
Data Inflexibility
Many self-service tools are limited in how users can join or explore data. If the data model is too rigid, users cannot combine information in new ways to uncover insights.
Solution: Use AI-powered tools that support flexible reporting and dynamic joins in the front end. This enables business users to slice data as needed, eliminating the need for IT to restructure the backend.
Non-native Interfaces
Traditional self-service platforms often require users to switch to a separate analytics tool to gain insights. This adds friction and slows adoption.
Solution: Choose platforms that embed analytics directly into the tools your team already uses. With native integration, insights appear in context, where decisions are made. This improves both usability and adoption.
Incorporating Self-service Analytics as Part of Your Organization
Rolling out self-service analytics the right way is key to success. Here is a simple step-by-step approach to make it work inside your company.
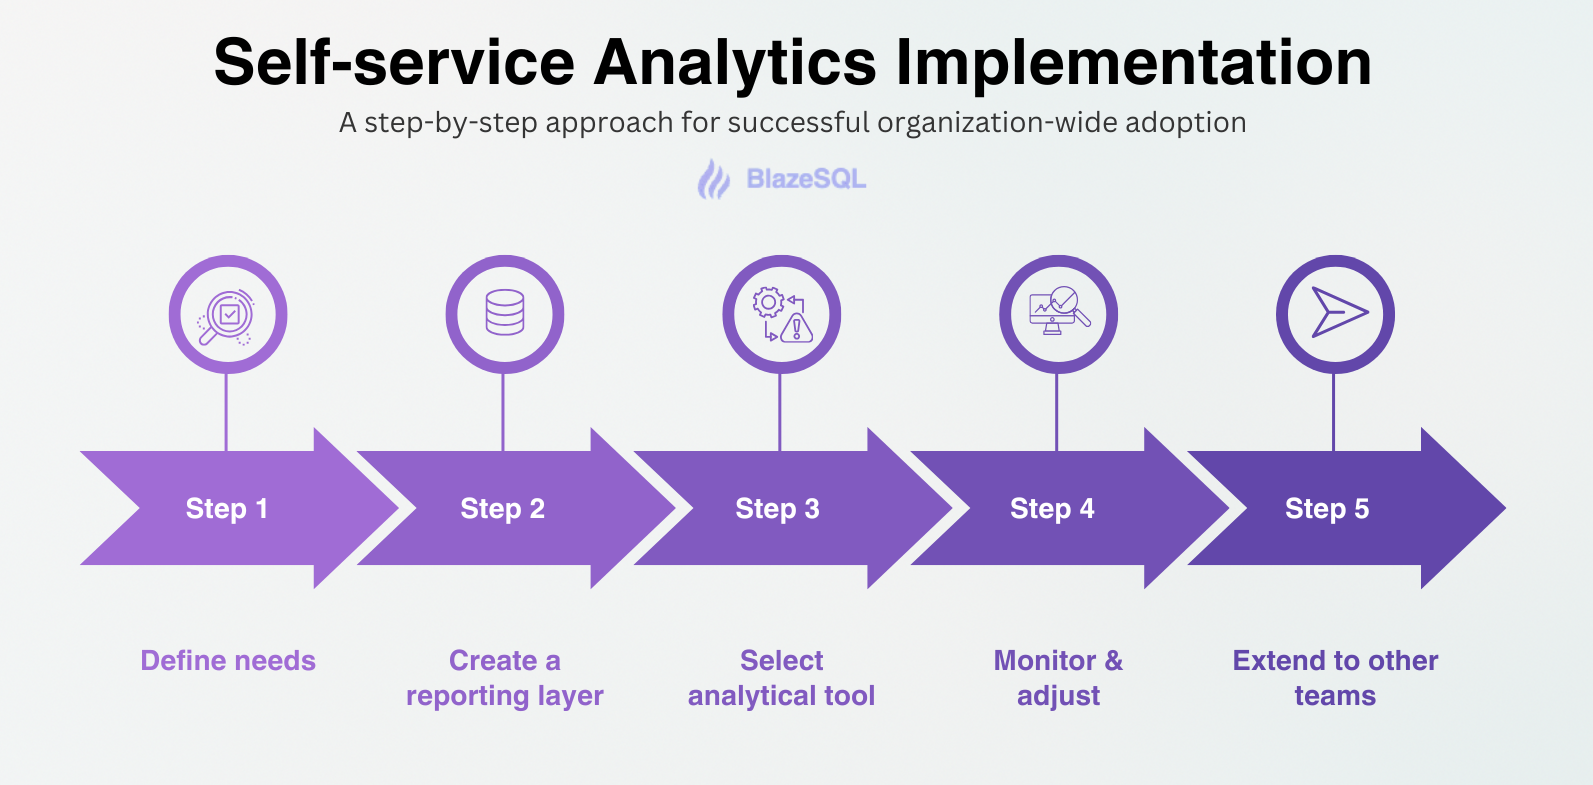
1. Define Needs
Start by clearly defining who needs to self-serve and what data they need access to. Focus on one team or function that will benefit the most from fast access to insights. Keeping it focused early helps you build momentum.
2. Create a Reporting Layer
Next, set up a reporting layer in your database that makes the necessary data easy to query, such as an SQL database. Ideally, store your data in a centralized data warehouse. When building the reporting layer, focus on:
- Simplifying core tables and fields
- Making common queries easy to run
- Keeping the structure clean and consistent
This step sets the foundation for easy self-service later.
3. Select and Set Up a Self-service Analytics Tool
Choose a self-service analytics tool that fits your users’ needs. Tools like BlazeSQL allow you to connect your SQL database in seconds, resulting in a minimal setup time. Ensure the tool seamlessly integrates with your reporting layer, enabling users to gain insights without requiring knowledge of SQL or database structures.
4. Monitor Usage and Adjust
After rollout, monitor how users interact with the tool to ensure it is effective. Are they finding the data they need? Are certain areas harder to access than expected? Use this feedback to adjust the reporting layer, improve the user experience, or add missing data sources as necessary.
5. Extend to Other Teams
Once the pilot phase is successful, expand to other teams. Extend the reporting layer, add new datasets, and roll out access carefully. To expand smoothly:
- Train new users in small groups
- Share success stories from early adopters
- Keep gathering feedback and improving access
Each new team should build on the successes of the past, creating a stronger data-driven culture across the company.
Top 5 Self-service Analytics Tools in 2025
The best self-service analytics platforms are easy to use, fast to set up, and powerful enough to grow with your business. Here are the top tools making waves in 2025.
1. BlazeSQL
BlazeSQL is setting a new standard for what self-service analytics can be. It empowers business teams by eliminating the need to wait for data analysts to provide insights. Instead, Blaze acts like your personal data analyst, delivering instant answers and enabling deeper exploration of trends and insights.
Users simply type their questions in plain English. BlazeSQL then translates them into SQL, runs the query, and instantly visualizes the results.
BlazeSQL is packed with features like:
- Natural language query & dashboard drill-down
- Recommend relevant visualizations
- Drag-and-drop dashboards
- Slack Integration
- AI-generated email reports
- Automated Actions & Email Triggers
- Enterprise-level security
2. Tableau
Tableau is known for its powerful data visualization capabilities. Users can drag and drop their data into beautiful dashboards, uncover patterns, and share insights across teams.
It is often used in industries that need complex visual analysis. Tableau now also offers more AI-powered features, helping users forecast trends and identify key drivers behind metrics.
3. Microsoft Power BI
Power BI remains a favourite among companies already using Microsoft's ecosystem. It integrates seamlessly with Excel, Teams, and Azure. It offers a wide range of visualization options, powerful data modeling capabilities, and natural language querying.
Power BI is a solid choice for organizations seeking a balance between affordability, functionality, and ease of use.
4. Qlik
Qlik stands out for its associative data engine. Unlike traditional query-based tools, it lets users explore data without being limited by pre-set queries.
Qlik enables deeper discovery and facilitates the easier identification of hidden patterns. It also offers robust self-service visualization capabilities, predictive analytics, and AI-driven suggestions for deeper insights.
5. ThoughtSpot
ThoughtSpot is a self-service analytics tool built for search. Instead of creating reports manually, users simply type a question, and ThoughtSpot instantly generates charts, tables, and visual insights. It's simple, fast, and ideal for non-technical teams that want quick answers without the hassle of setting up complex dashboards.
ThoughtSpot is heavily focused on AI-powered insights, making it a strong contender for organizations that prioritize speed and simplicity.
The Future of Self-Service Analytics
Self-service analytics is transforming the way businesses operate. As tools become smarter and easier to use, data will become an integral part of every role, rather than being handled solely by specialists. Companies that move quickly with data will lead the market.
BlazeSQL is built to help you get there. Contact BlazeSQL today and see how our platform can unlock faster insights and more intelligent decisions for your team.
Ready to unlock faster insights and smarter decisions?
Frequently Asked Questions (FAQs)
What’s the difference between self-service analytics and traditional business intelligence? Traditional Business Intelligence requires data analysts or IT professionals to prepare and deliver reports. Self-service analytics enables business users to explore data independently without requiring technical assistance.
Do I need technical skills to use self-service analytics tools? No. Most modern tools are designed with non-technical users in mind. Features like natural language queries, drag-and-drop dashboards, and AI-powered insights make it easy to use.
How do I know if my company is ready for self-service analytics? If your teams frequently request reports or rely on IT or data analysts to pull data, and especially if there's a growing backlog of requests, your company is ready for self-service analytics. It’s a clear sign that your current process is slowing down decision-making. Self-service analytics empowers teams to access insights instantly, reducing bottlenecks and enhancing speed, agility, and informed decision-making across all departments.
Can self-service analytics be used across different industries? Yes. From retail and consumer packaged goods (CPG) to healthcare, logistics, and finance, any data-driven organization can benefit from faster, easier access to insights.
What makes BlazeSQL different from other self-service analytics tools? BlazeSQL combines AI-generated SQL with a user-friendly interface and native embedding. It brings insights directly to where users need them, with no technical skills required.