


Automated Business Intelligence: What It Actually Is, What It Automates, and How to Get It Right

Let’s be honest about the data loop. The same ad hoc questions keep flooding in. Reports take hours to update. By the time the insights actually reach the decision-makers, the window to act is gone.
"Automated business intelligence" is supposed to fix this. But what does that actually mean when you strip away the landing page copy?
Here is the uncomfortable truth: most teams trying to automate their BI end up deeply disappointed. Not because the technology is broken. They just automate the wrong things, in the wrong order, without fixing their data foundation first. Meanwhile, a handful of teams are quietly transforming how they operate. They are saving days of analyst capacity every week, making self-service a reality, and finally killing the data bottleneck.
This guide separates what actually works from what doesn't. We'll look at where the hard ROI comes from, why bolt-on AI fails in production, and how to sequence your rollout so it sticks.
TL;DR: The Key Takeaways
- It's more than scheduled emails: Real automated BI handles reporting, monitoring, and ad hoc analysis. Setting a dashboard to refresh at midnight doesn't cut it anymore.
- The ROI is capacity: Teams that get self-service right report saving 1–2 days per week of analyst time.
- Bolt-on AI usually fails: Legacy BI tools with an AI chat window tacked on lack business context. AI-native tools built for this specific job perform significantly better in production.
- Start narrow: Don't try to automate the whole company at once. Pick 20–30 common questions. Hit 90%+ accuracy. Then expand.
- Dashboards are just demoted: They aren't dead. They are just becoming less central as business users learn to ask questions directly.
---
Not sure which approach fits your current stack? The right tool depends heavily on your data maturity and team structure.
Not sure which solution is right for your needs? Take our quick 2-minute assessment to get personalized recommendations.
---
What Is Automated Business Intelligence?
Automated BI means using systems to reduce the manual labor required to collect, analyze, and deliver data. But that definition is so broad it's basically useless.
Let's get specific.
What automated BI is NOT:
- A data warehouse or ELT tool (it sits on top of your existing stack).
- Just scheduling dashboard refreshes (that is table stakes).
- A magic black box that fires your analytics team.
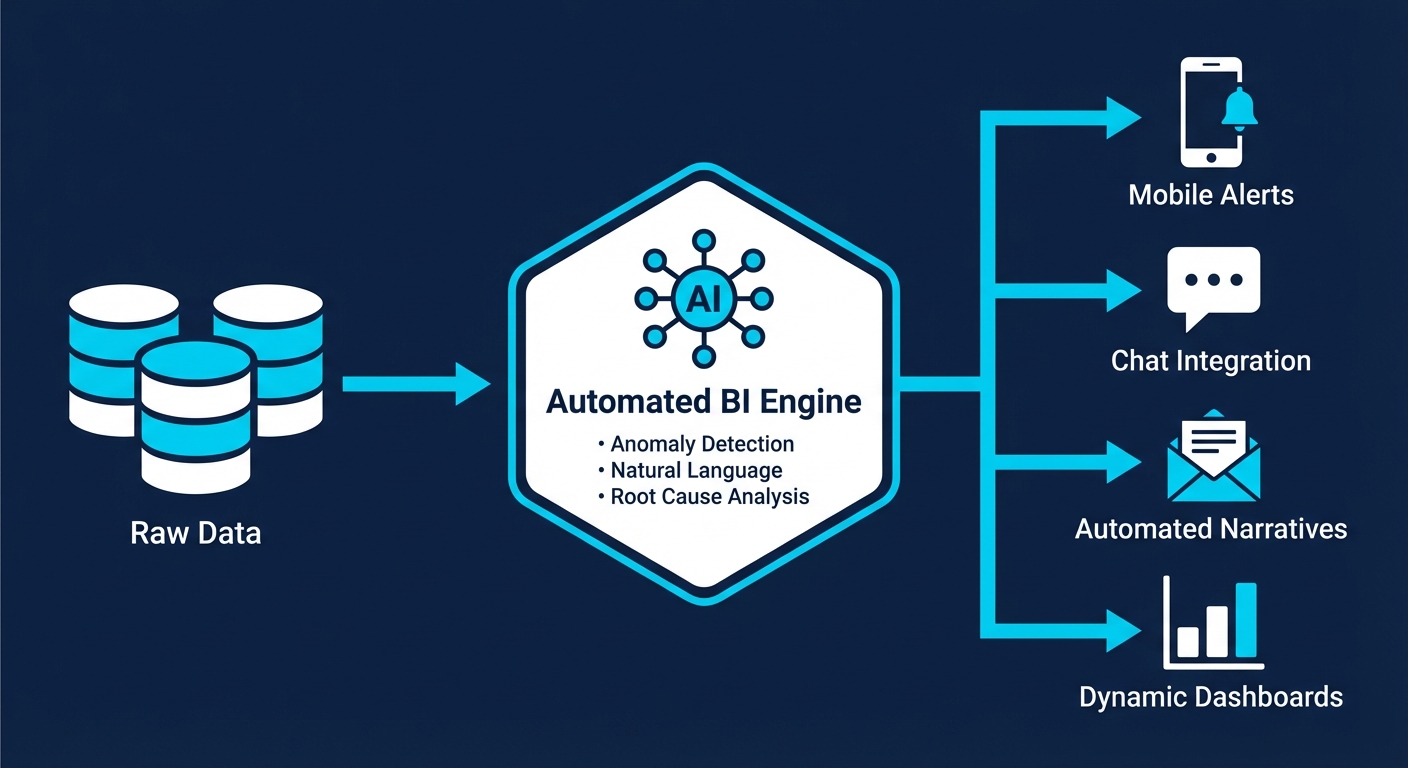
What automated BI actually automates:
- Data refresh and distribution: Pushing scheduled updates on a rigid cadence.
- Threshold monitoring and alerts: Pinging you when a metric crosses a hard line (e.g., inventory hits zero).
- Anomaly detection: AI flagging weird patterns without rigid rules (e.g., a sudden, unexplained spike in returns).
- Natural language querying: Business users asking plain English questions and getting answers. Zero SQL required.
- Automated narratives: AI writing brief explanations of what changed and why, so you don't have to parse a chart.
- Root cause analysis: Systems automatically drilling down to find the drivers behind a dropped metric.
- Closed-loop actions: Insights directly triggering workflows (like creating a Jira ticket or adjusting ad bids).
The market is confused right now. Vendors use "automated BI" to sell everything from a scheduled email (Level 1) to autonomous decision-making (Level 7). Sales reps are demoing Levels 6 and 7. Most organizations are stuck at Levels 1 or 2.
"What people probably understand and what I would call truly automated business intelligence is that if it's truly automated, the ad hoc analysis—which historically hasn't really been fully automated because of the technical bottleneck—actually works. LLMs have only become good enough to reliably be used for self-service as of maybe 2025."
---
Traditional BI vs. Automated BI: What Actually Changes
This shift isn't about replacing all your dashboards with chatbots. It's about changing who can access insights and how fast they can get them.
| Dimension | Traditional BI | Automated BI |
|---|---|---|
| Ad hoc questions | Submit request to analyst, wait hours/days | Ask directly, get answer in seconds |
| Report creation | Analyst builds dashboard, schedules refresh | System generates insights, users create own views |
| When anomalies occur | Noticed during scheduled review (if at all) | Proactive alert with context |
| Drill-down analysis | Request follow-up analysis from analyst | AI automatically investigates root causes |
| Learning curve | Learn tool interface, understand data model | Ask questions in natural language |
| Bottleneck | Analyst capacity | Data quality and business context |
What stays exactly the same:
- You still need solid, clean data infrastructure.
- You still need humans to define the core business logic.
- You still need strict access controls.
Dashboards aren't going anywhere. They just become optional. Here is a highly pragmatic take from an operator on Reddit that nails this nuance:
Key insight: Dashboards used to be your only scalable delivery mechanism. Now that natural language querying actually works in production, dashboards are just one tool in the toolbelt.
---
The Real ROI of Automated Business Intelligence
"Faster insights" is generic marketing fluff. Let's look at the actual numbers.
Where the Time Savings Come From
Analyst time reclaimed: According to Alteryx's 2025 State of Data Analysts report (n=1,400), 45% of data professionals still spend over six hours per week just cleansing and preparing data. That's before any analysis even happens.
When automated BI actually works, your data team stops acting like SQL monkeys for recurring ad hoc requests. Trengo (a B2B SaaS company) reported saving 1.5 days per week per analyst after getting self-service analytics right. If you have a three-person data team, that is 4.5 days of raw capacity handed back to you every single week.
Decision velocity: KeyBank reported a 1–2 day reduction in production time for their SEC reports after automating financial reporting. They hit 50% automation immediately and expect 90% once fully rolled out.
The hidden cost (questions never asked): The hardest ROI to measure is the graveyard of questions nobody asks because "it's not worth the wait." When self-service removes the friction of Jira tickets, teams uncover insights that would have otherwise stayed buried.
ROI Benchmarks to Consider
| Metric | Industry Benchmark | Source |
|---|---|---|
| Time spent on data prep | 45% spend 6+ hours/week | Alteryx 2025 (n=1,400) |
| Analyst time saved with working self-service | 1-2 days/week | Multiple case studies |
| BI dashboard utilization | ~20% after 6 months | Parable Associates estimate |
| Automation ROI (general process) | 240% average | Symtrax 2025 |
| Time to recoup automation investment | 6-9 months typical | Symtrax 2025 |
Try this: Before rolling out a tool broadly, track two pilot KPIs. First, track query accuracy (target 90%+ correct before inviting non-technical folks). Second, track adoption rate (perfect accuracy means nothing if nobody logs in).
---
The Automation Maturity Model: Where Are You?
You don't need autonomous AI agents running your business today. Here is a realistic look at the automation spectrum:
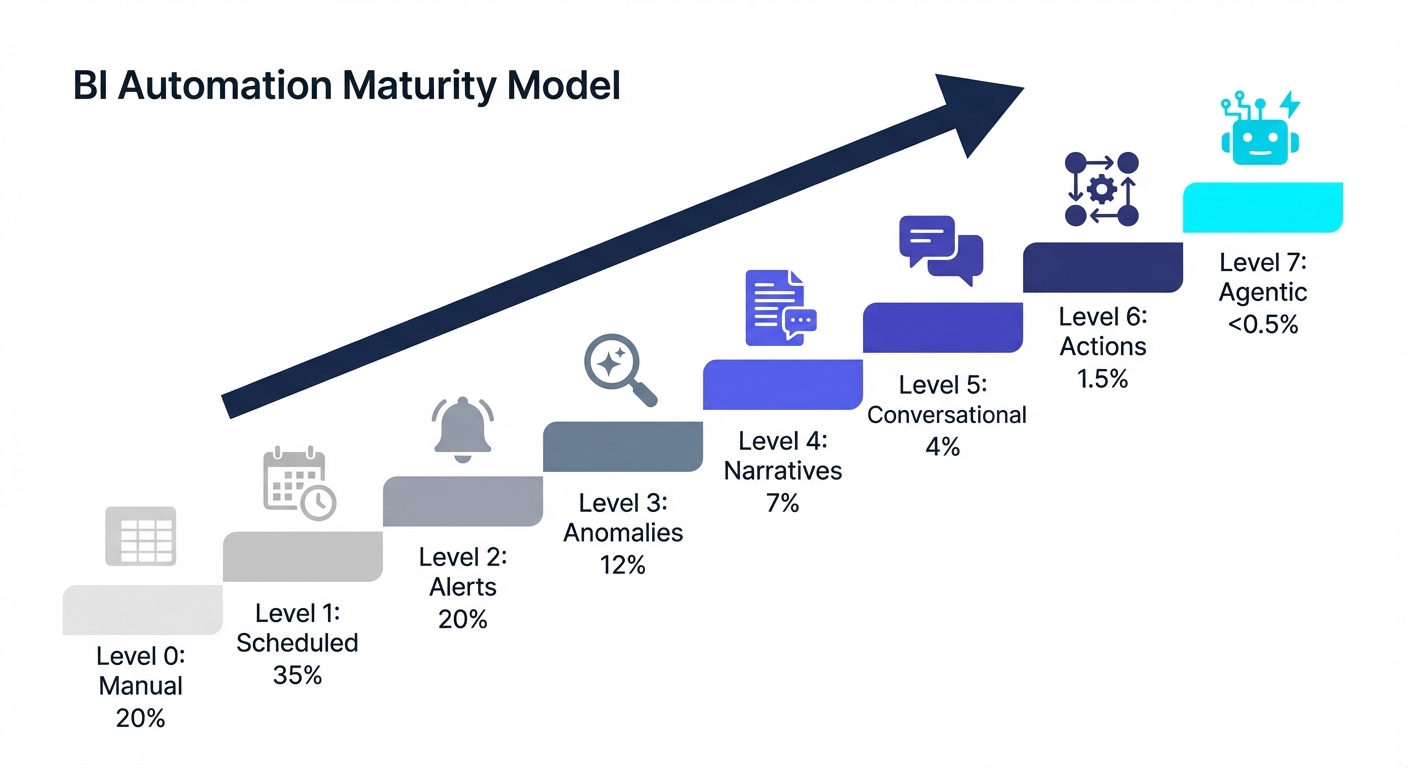
- Level 0: Manual Everything (~20% of orgs). Data lives in spreadsheets. Reports are copy-pasted. Every question requires manual SQL.
- Level 1: Scheduled Refresh (~35% of orgs). Dashboards refresh themselves. Reports are emailed on a cadence. But users still have to go look at a dashboard to see what happened.
- Level 2: Threshold Alerts (~20% of orgs). Proactive pings when a metric crosses a line ("Revenue dropped below $X"). A human still has to figure out why.
- Level 3: Anomaly Detection (~12% of orgs). AI spots weird patterns without predefined rules. You find out about conversion drops immediately, not during a monthly review.
- Level 4: Automated Narratives (~7% of orgs). Natural language summaries explain the charts. "Revenue increased 12% WoW, primarily driven by enterprise."
- Level 5: Conversational Analysis (~4% of orgs). Business users ask plain English questions and get answers. Follow-up questions work. This is where self-service actually gets real.
- Level 6: Closed-Loop Actions (~1.5% of orgs). Insights trigger workflows. Low inventory alerts draft purchase orders. (Humans still approve them).
- Level 7: Agentic Analytics (<0.5% of orgs). Autonomous AI agents monitor, analyze, decide, and act completely on their own. Almost nobody is actually here yet.
What this means: The real operational transformation happens when you cross into Levels 5 and 6. But most companies are currently stuck at Levels 1 and 2, struggling to get Level 3 reliable.
---
Why Automated BI Projects Fail (And How to Avoid It)
Gartner estimates that over 60% of BI initiatives fail to deliver business value. Throw AI into the mix, and that failure rate goes up. Here is exactly why these projects die—and how to prevent it.
Failure Mode #1: Buying Tech Before Defining the Bottleneck
Teams buy a shiny tool before looking at their actual workflows. They implement the tool, build new dashboards, and nothing changes. Why? Because they didn't solve the core problem. The fix: Audit your data team's request queue. What top 10 questions eat up the most hours? Start exactly there.
Failure Mode #2: Dirty Data, Broken Trust
AI will not fix your messy data. It will just scale your mistakes. IBM's research confirms that AI systems "inherit and amplify data quality issues. When data is inconsistent, incomplete, biased, or outdated, both models and the agents built on top of them are less accurate." The fix: Lock down your data governance first. Organizations with documented governance reduce analytics rework by 62% and cut time-to-insight by 40%.
Failure Mode #3: Missing Business Context
LLMs can write flawless SQL, but they cannot read your mind. They do not know what an "active user" means to your specific company, which sandbox accounts to exclude, or how your fiscal calendar works. Common traps:
- Multiple date fields (Is it "created_at" or "processed_at"?)
- Test data (Internal accounts ruining your averages).
- Tribal terminology (Business jargon that doesn't match the database columns).
The fix: Treat business context as a core feature. Choose tools that make it dead simple to define your specific business logic.
Failure Mode #4: Bolt-On AI That Buckles
Here is a candid review from an operator in the trenches regarding legacy tools adding AI:
Many enterprise vendors slapped a chat window onto their existing architecture just to check an AI box. These "bolt-ons" usually fail in production because they weren't built for conversational interaction from day one. The fix: Differentiate between AI-native platforms (built around LLMs) and platforms that just bolted AI on. Architecture matters.
Failure Mode #5: Boiling the Ocean
Trying to automate the entire company at once is a recipe for scope creep. Accuracy tanks because context is stretched too thin, and the project stalls out. The fix: Pick one domain. Master a handful of questions.
"I would say if you can get like 20-30 questions that are relatively representative and cover good ground and you have an accuracy above 90%, then you're pretty good. And also, people can always still ask for review when things look off..."
---
How to Implement Automated BI Successfully
Based on patterns from teams that actually pull this off, here is your playbook:
Phase 1: Foundation (Weeks 1-2)
- Audit the queue: Look at what is actually consuming your analysts' time.
- Identify golden questions: Pick 10–20 recurring, annoying questions. Ignore complex edge cases for now.
- Assess data readiness: Are your table names clear? Is test data clearly marked?
Phase 2: Pilot (Weeks 3-6)
- Connect the pipes: Plug your modern tool into Snowflake, BigQuery, Postgres, etc., to extract metadata.
- Test the golden questions: Run your 20 queries. Grade the AI.
- Add business context: Feed the system your metric definitions and exclusions. (Keep it lean—too much context confuses the LLM).
- The Target: Do not invite users until you hit 90%+ accuracy on these test questions.
Phase 3: Controlled Rollout (Weeks 7-12)
- Invite one team: Start with Marketing or Ops (they usually have the highest ad hoc demand).
- Monitor everything: Watch what they ask. Audit the accuracy.
- Patch the gaps: Users will immediately ask questions that highlight missing business definitions. Add them fast.
- Track adoption: If they go back to filing Jira tickets, find out why immediately.
Phase 4: Expansion (Ongoing)
- Roll out domain by domain: Expand carefully.
- Maintain visibility: Set up sampling to ensure accuracy doesn't drift.
- Layer on automation: Now you can add scheduled digests and closed-loop alerts.
---
Tools for Automated Business Intelligence
The landscape is currently split into three camps: legacy platforms adding AI, purpose-built AI-native platforms, and semantic/governance layers. Here is the pragmatic breakdown.
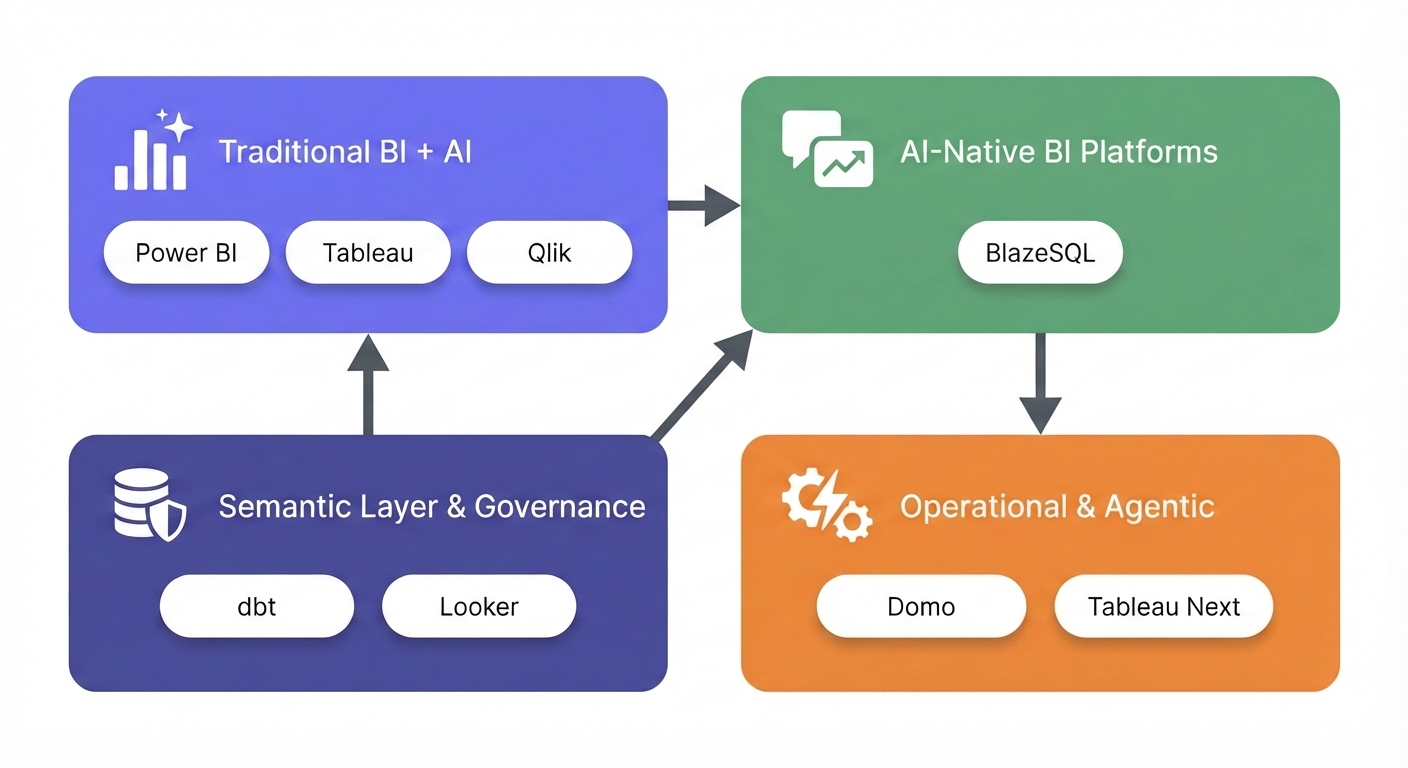
Traditional BI Platforms with AI Features
These are the heavyweights that bolted copilots onto their existing architecture.
- Power BI (with Copilot): Microsoft injected Copilot across its platform for report creation, DAX generation, and summaries. Deep integration with the Microsoft ecosystem and great scheduled alerting. But it requires expensive Fabric or Premium capacity, and users consistently report it struggles with complex data models. The AI feels distinctly bolted-on. Starts at $10/user/month (Pro); Premium capacity starts at $4,995/month.
- Tableau (with Pulse and Einstein): Salesforce added Tableau Pulse for proactive insights and Einstein AI for chat. Still an unbeatable visualization engine with exceptional formatting control. However, Einstein costs extra (~$1,200/user for developers). Users report the AI struggles with messy data. Creator licenses run around $70/user/month.
- Qlik Sense: Offers Qlik Answers for natural language, leaning heavily on its associative data modeling. It's an incredible engine for exploring data without predefined paths. Broad data source connectivity. The catch? Brutal learning curve, rigid visuals, and the newer AI features are still maturing. Starts at $300/month (10 users).
AI-Native BI Platforms
These platforms were architected from day one around natural language and LLMs.
- BlazeSQL: A purpose-built AI analytics platform connecting directly to SQL databases for plain English querying. Built specifically for natural language. It uses a "reliability architecture" (knowledge notes, training questions, query review) that actually solves the business context problem. Handles full dashboards and supports agentic workflows. But it is limited to SQL databases only (no NoSQL or direct SaaS connectors) and has fewer pixel-perfect formatting options than Tableau. Starts around $400/month for 3 users.
Semantic Layer & Data Governance
These aren't visualization tools. They lock down your metric definitions so the AI doesn't hallucinate.
- dbt (Semantic Layer): Centralizes metric definitions so all downstream tools query the exact same logic. Massive adoption in data engineering. It allows AI to query clean, governed metrics instead of raw tables. But it is highly technical to implement, and you still need a BI tool on top of it. dbt Cloud starts at $100/month.
- Looker: Google's Looker relies on LookML (a robust semantic layer) and recently added Gemini for conversational analytics. LookML guarantees consistent definitions and incredibly strong governance. But LookML is tough to learn, pricing is famously opaque, and users report a disjointed product experience post-Google acquisition. Custom quotes only.
Emerging: Decision Intelligence & Agentic Platforms
Systems built to execute decisions, not just deliver charts.
- Domo: A full-stack platform leaning into AI Services, Magic ETL, and workflows. Massive connector library (1000+ sources) and strong mobile experience with AI agents inside workflows. But costs spiral quickly, and token-based AI pricing makes budgeting a headache. Starts around $750/user/year plus AI tokens.
- Tableau Next (Agentic Analytics): Tableau's upcoming bet on autonomous AI agents that monitor and act continuously. Built for proactive continuous monitoring on the Einstein Trust Layer. Very new, and full agentic capabilities require a massive implementation lift.
Tool Comparison Matrix
| Tool | NLQ Strength | Self-Service Ease | Pixel-Perfect Reporting | Data Source Breadth | On-Premise Option | Learning Curve | Starting Price |
|---|---|---|---|---|---|---|---|
| Power BI + Copilot | Moderate | Moderate | Strong | Broad (400+ connectors) | Yes | Medium | $10/user/mo |
| Tableau + Pulse | Moderate | Moderate | Excellent | Very Broad (90+ native) | Yes | Medium-High | $70/user/mo |
| BlazeSQL | Strong | High | Basic | SQL databases only | No | Low | ~$400/mo |
| Qlik Sense | Moderate | Moderate | Strong | Broad | Yes | High | $300/mo |
| Looker + Gemini | Moderate | Low-Moderate | Strong | Broad | Partial | High | Custom |
| Domo | Moderate | Moderate | Moderate | Very Broad (1000+) | Partial | Medium | $750/user/yr |
How to read this table: No tool wins everywhere. AI-native platforms like BlazeSQL trade enterprise reporting polish and broad data connectivity for dramatically better natural language capabilities and ease of use. Traditional platforms offer the opposite: mature reporting features and massive connector libraries, but AI that often disappoints in production. Your choice depends on whether your bottleneck is "people can't get answers" or "reports don't look professional enough."
If you're still weighing options, our assessment tool cuts through the noise to find what fits your specific stack.
Get personalized tool recommendations based on your data maturity, team structure, and specific requirements.
---
The Future: Agentic Analytics and Decision Intelligence
Where is this heading? The industry is currently obsessed with two concepts: agentic analytics and decision intelligence.
Agentic Analytics: Beyond Insight to Action
This means AI doesn't just surface insights—it senses, analyzes, decides, and acts. It doesn't just tell you inventory is low; it drafts the purchase order.
The data:
- Gartner predicts 15% of day-to-day work decisions will be made autonomously by AI agents by 2028.
- Deloitte's 2025 data shows 30% are exploring, 38% are piloting, but only 11% have agentic options in production.
The operator view:
The pragmatic play: Keep a human in the loop. Build systems that suggest actions and draft responses. Only once a human has blindly approved those drafts for six months do you consider removing them.
Decision Intelligence: From BI to DI
Decision intelligence (DI) engineers how decisions are actually made. It shifts the question from "what happened?" to "what exactly should we do about it?"
The market for DI is expected to hit $17.5 billion in 2025. Practically, this means the line between a "BI tool" and an "operational tool" is collapsing.
The Semantic Layer Becomes Critical
As natural language becomes the primary way you interact with data, your semantic layer becomes your primary defense against AI hallucinations:
What this means: There is a massive difference between tools that translate natural language directly to SQL (highly prone to hallucination) and tools built with mechanisms to capture business context. Context is what separates an impressive demo from a tool that actually works in production.
---
When Automated BI Makes Sense (And When It Doesn't)
This technology isn't for everyone. Here is how to quickly gut-check if you are ready:
Good Fit Signals
✓ The bottleneck is bleeding you: Your data team spends their days answering basic, recurring questions instead of doing strategic work. ✓ The infrastructure exists: You actually have a SQL database or data warehouse to plug into. ✓ Metrics are definable: Someone in the building actually knows how your core metrics are calculated. ✓ Broad stakeholder demand: The ROI scales exponentially with the number of non-technical people who need data.
Poor Fit Signals
✗ No database: If your data lives entirely in Google Sheets or isolated SaaS apps, you need a data stack first. ✗ Tribal confusion: If nobody agrees on what "revenue" means, AI will just help you arrive at the wrong answer faster. ✗ Low data maturity: If you don't track key metrics today, automation won't solve your underlying operational issues. ✗ One analyst, low volume: If one person comfortably handles all requests, the setup overhead might not be worth it yet.
---
Getting Started: Your Next Steps
If you're still reading, you're likely the person tasked with figuring this out. Here is what to do next:
Step 1: Assess Your Starting Point
- Where do you sit on the maturity model (0–7)?
- How deep is your analyst backlog right now?
- Is your data actually clean enough to query?
Step 2: Define Success Criteria
- What specific questions must this solve to be worth the money?
- How will you measure query accuracy?
- What adoption rate from business users defines a "win"?
Step 3: Evaluate Tools Against Your Reality Ignore the perfect vendor demo. Test these tools against your messiest data, your actual repetitive questions, and your team's real technical limits.
The right tool depends entirely on your starting line. For a pragmatic recommendation based on your specific situation, use the assessment below:
Take our 2-minute assessment to get matched with the automated BI approach that fits your data maturity, team structure, and goals.
---
Wrapping Up
Automated business intelligence is real, and the ROI is absolutely there. When done right, it kills the analyst bottleneck, makes self-service a reality, and speeds up decision cycles. But the gap between a flashy demo and a production-ready system is incredibly wide.
The teams actually winning with this tech follow the same pragmatic playbook:
- They start small and validate accuracy before expanding.
- They treat data quality and business context as absolute prerequisites.
- They choose AI-native tools purpose-built for the job, rather than legacy tools with chat bolted on.
- They rigorously measure user adoption.
The hype around autonomous AI agents will keep spinning. Don't wait around for perfect AI. Implement the automation that works today, and build the foundation that will unlock the rest tomorrow.
The question isn't whether you will automate your BI. It's whether you'll automate the right things, in the right sequence, with the right tools.
Dashboards being under-utilised isn't an indication that dashboards are inherently bad. If 80% of them aren't being used then you failed to assess the businesses properly and to solve it properly. Also Dashboards aren't going anywhere lol. Even with the rise of AI and agentic approaches.
View on Reddit