5 Best Snowflake Data Visualization Tools
Snowflake is a widely used cloud data platform for efficiently storing and analyzing large datasets.
However, effective data visualization tools are crucial to making that data actionable.
This blog will look at the best data visualization and reporting tools that integrate seamlessly with Snowflake. These tools help you turn raw data into charts, graphs, and visuals, making it easier to understand and use the data for informed decisions.
List of the Best Snowflake Data Visualization Tools
- BlazeSQL
- Microsoft Power BI
- Tableau
- Datameer
- Looker Studio
1. BlazeSQL
BlazeSQL is an AI platform that connects to your Snowflake database, turning data into easy-to-understand and insightful visuals by running SQL queries. It is designed for users of all skill levels, enabling rapid data analysis with minimal effort.
BlazeSQL’s AI Copilot and chatbot automate SQL queries and generate detailed visualizations and reports, simplifying the analysis process
It boosts productivity by rapidly automating SQL queries within Snowflake, delivering visual data in real time.
BlazeSQL delivers data insights quickly and efficiently, benefiting everyone from product managers to CTOs
List of Features
- Data Visualization
- AI-Analytics Assistant
- Advanced-Data Security
- Interactive Dashboards
- AI Reporting
- Team Collaboration
Top 3 Features of BlazeSQL
1. Visualize Data by asking simple questions
BlazeSQL uses AI-driven natural language processing to generate insights from your Snowflake database, simplifying data analysis for all users. Just input your questions by chatting with the AI chatbot; it does the rest. The chatbot can retrieve and visualize the data, making it easy for you to understand your data at a glance.
2. Instantly build Graphs & data-driven Dashboards
Every data analyst has a different need for visualizing data. Some like it visualized in graphs, while others prefer an interactive dashboard.
With Blaze, you can create both.
From simple line graphs
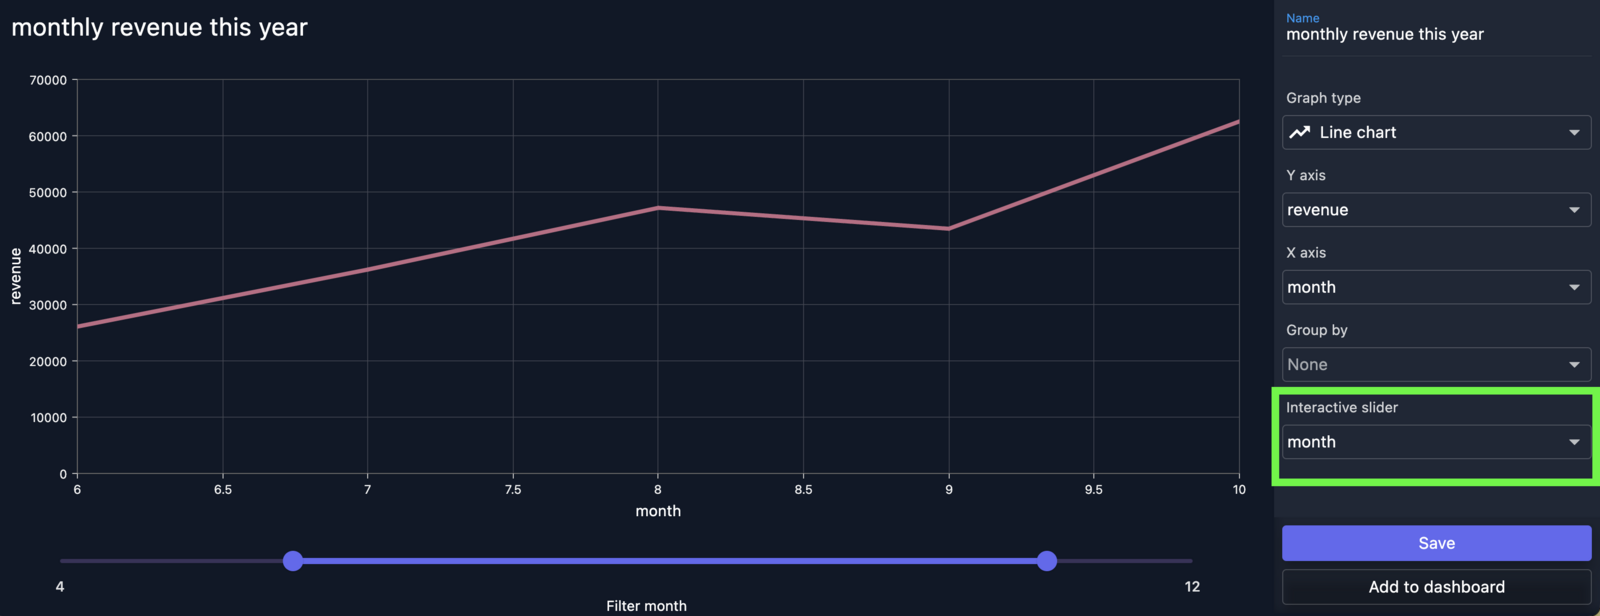
to bar charts
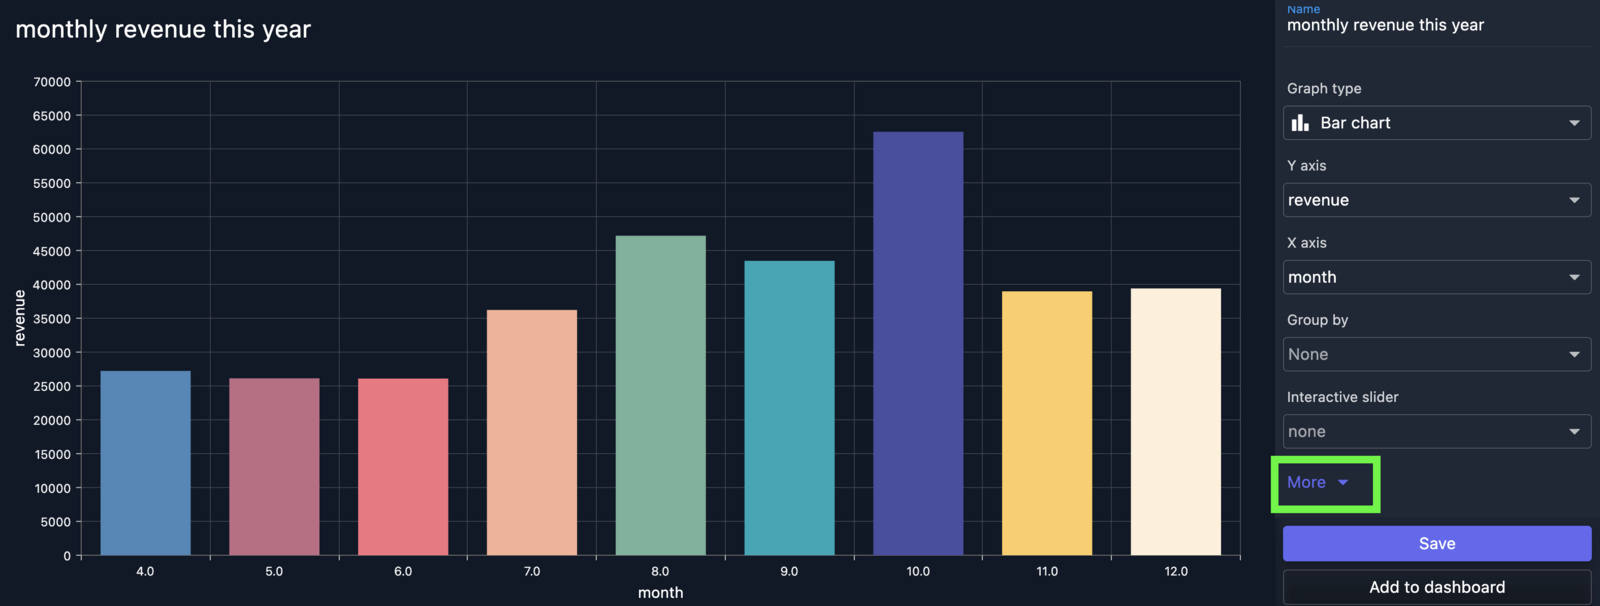
or for a more interactive view, take it to the next level with the visually appealing dashboards.
3. Simple Team Collaboration & AI Reporting
With BlazeSQL, working with a team is quick and easy. With just a few clicks, you can invite your team to work on analyzing and visualizing data in your Snowflake Database.

On top of that, AI reporting summarizes your weekly data updates, allowing you to focus on analyzing the data rather than putting manual effort.
Pros of BlazeSQL
- Offers a user-friendly experience for users of all technical levels
- Strong data security.
- Saves time with AI-generated insights and reporting.
- Supports all popular SQL databases.
- Ensures data privacy by only needing table and column names.
Cons of BlazeSQL
- Paid subscription is required for continued use after the trial period.
Some of the Other Supported Databases
- PostgreSQL
- Microsoft SQL Server
- BigQuery
- MySQL
- MariaDB
- AWS Redshift
BlazeSQL Pricing
- Blaze Pro: $39/month
- Blaze Advanced: $99/month
- Blaze Team: $149/month (starting)
- Blaze Team Advanced: $499/month (incl. 3 users, $75 per extra user)
- Blaze Enterprise: Custom pricing
Customer Support
- Email support
- Chat support
- Comprehensive help center
Final Verdict
BlazeSQL is a powerful tool for Snowflake data visualization. Its intuitive design, AI-driven tools, and robust visualization features make it a leading choice for businesses.
Whether you’re technical or not, BlazeSQL makes it simple to get the insights you need quickly and efficiently. Simplify your Snowflake data analysis and save valuable time. See the impact firsthand by starting your free trial now.
2. Microsoft Power BI
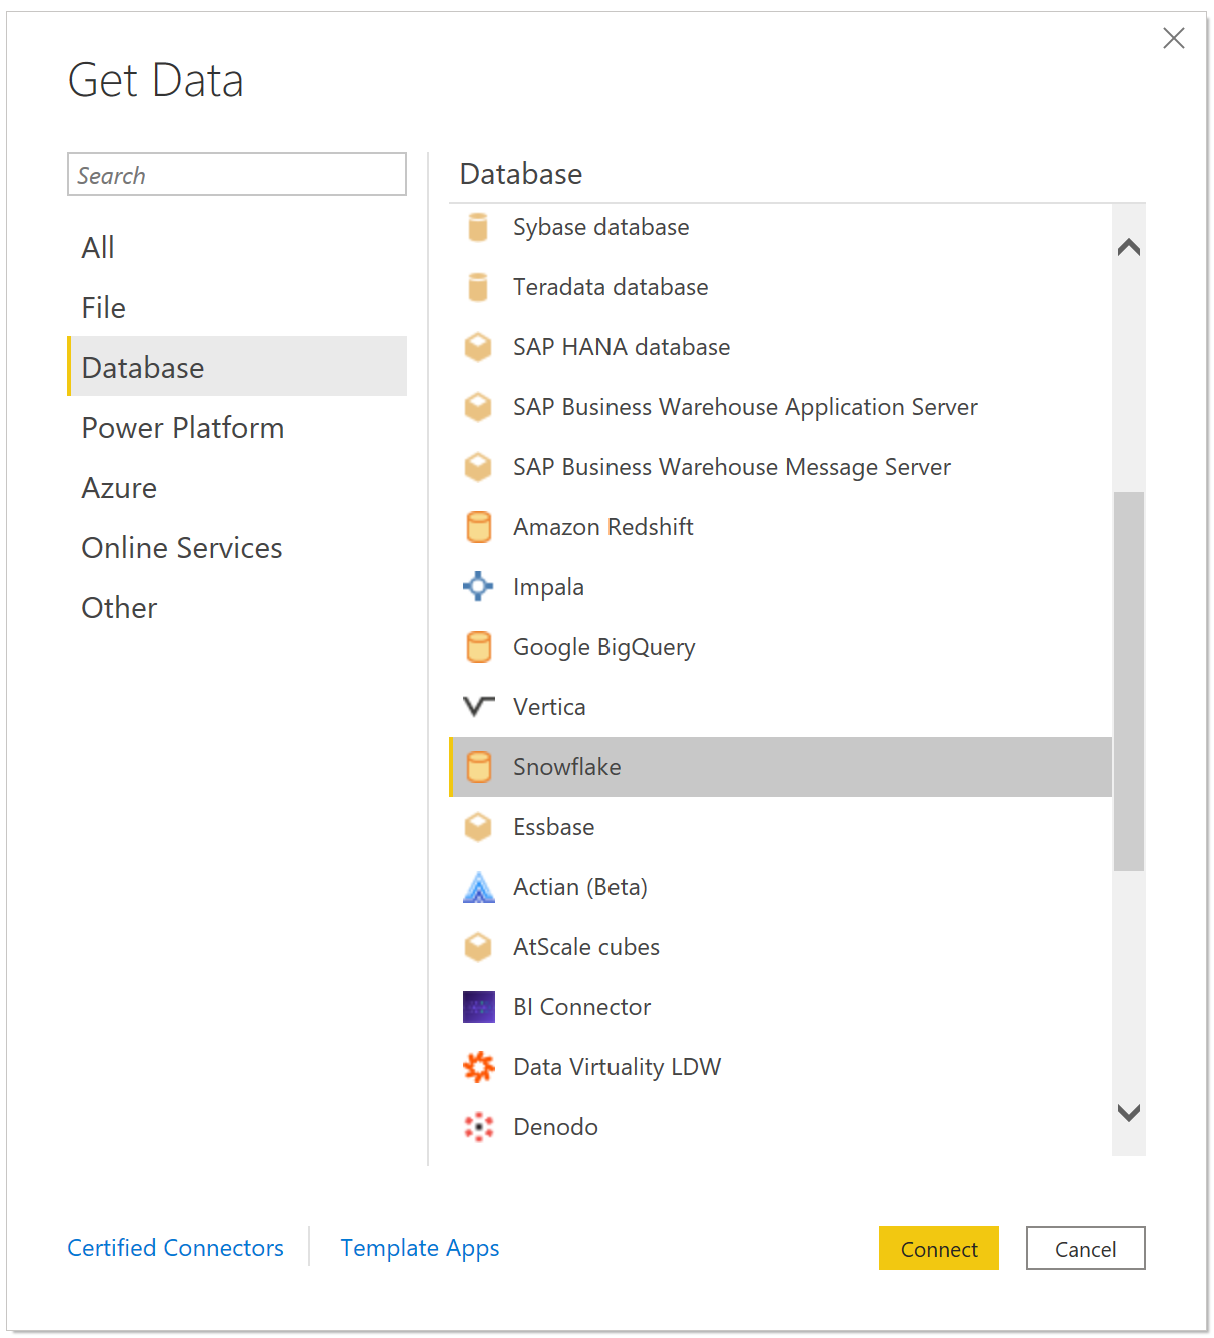
Microsoft Power BI is a top option for Snowflake data visualization at number two. With native integration, you can connect it to Snowflake and get a full view of your data.
Power BI is popular because it’s free to use and offers the option to upgrade for more features. This makes it a great choice for businesses of all sizes.
List of Features
- Comprehensive view of performance and operations
- Access and analyze data from multiple sources
- Data Visualization
- Real-time Analytics
- Customizable Dashboards
- AI-Powered Insights
Top 3 Features of Microsoft Power BI
1. Data Visualization
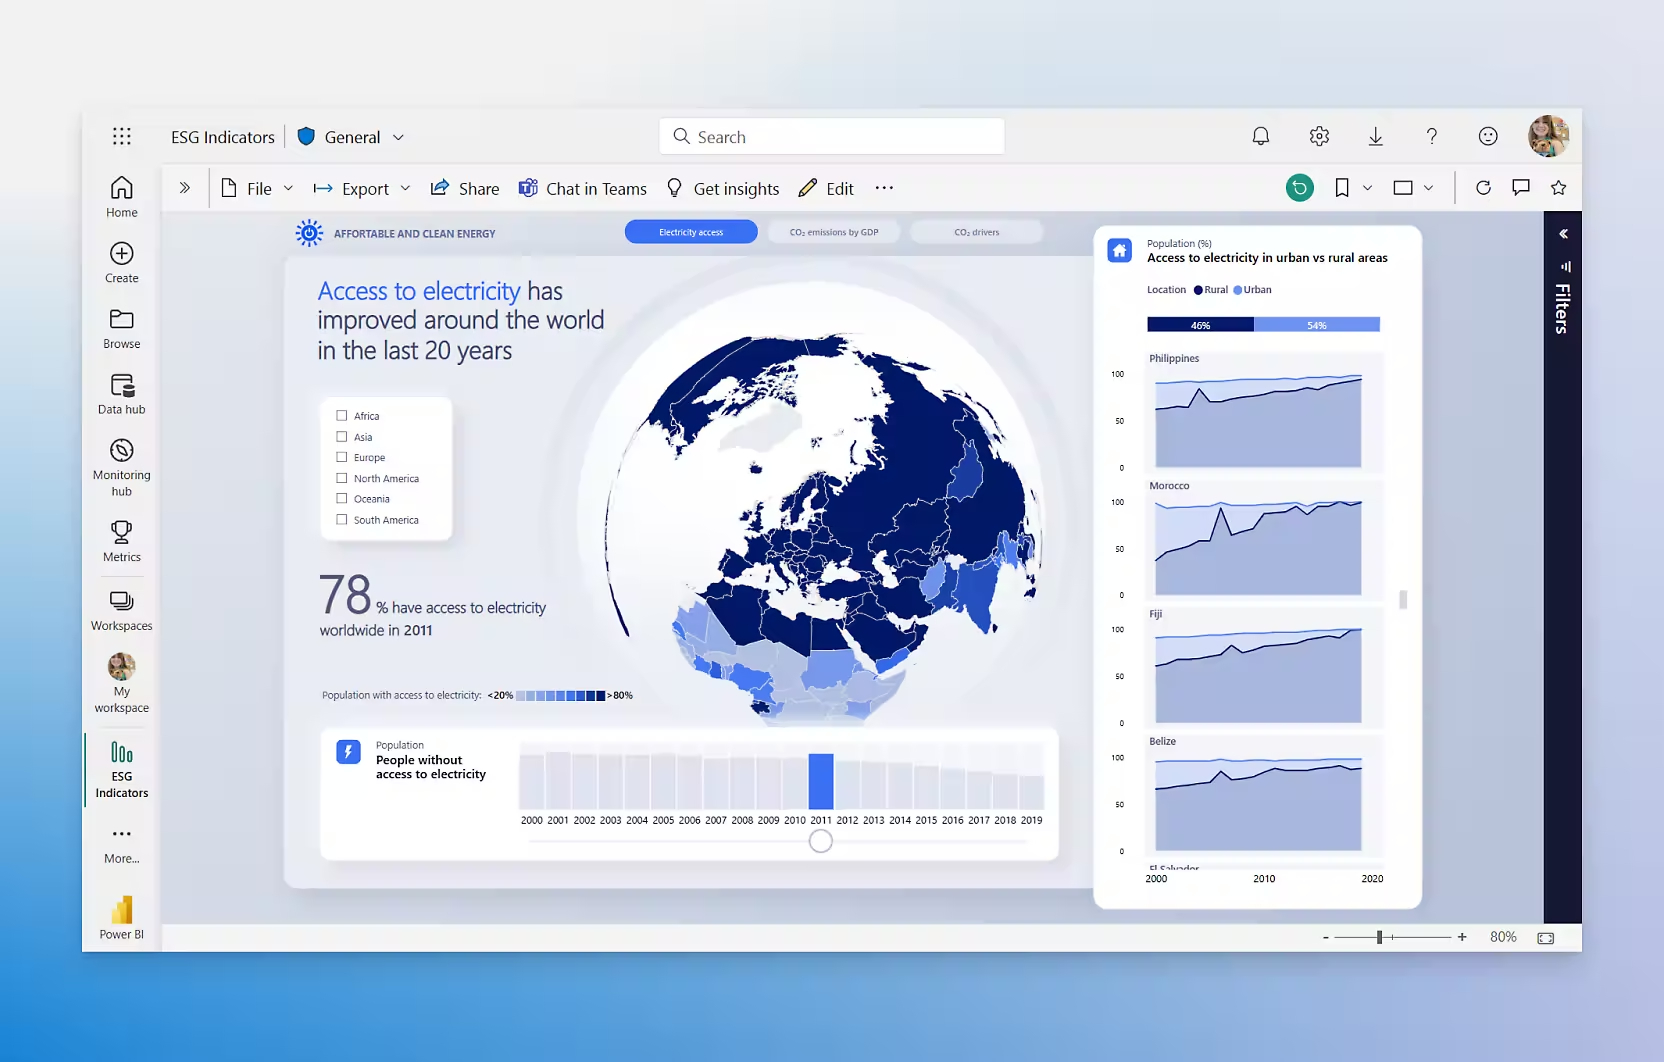
Power BI makes it easy to create beautiful charts and graphs from your Snowflake data. This helps you understand your data better and make informed decisions.
2. Real-time Analytics
With real-time data updates, you can monitor your Snowflake data live. This means you always have the latest information at your fingertips.
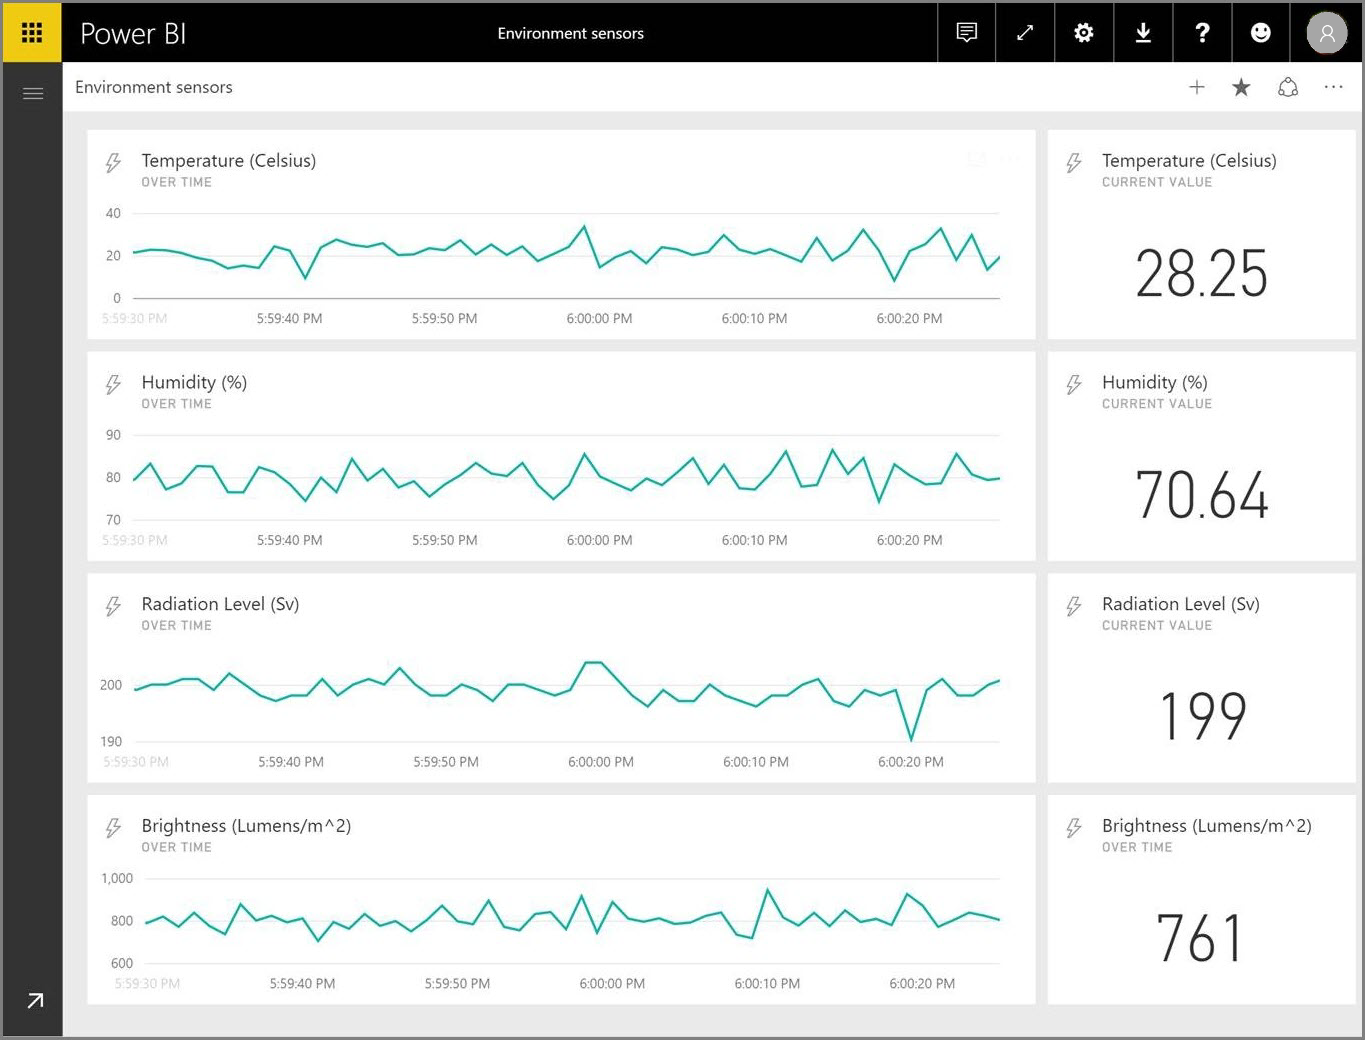
3. Customizable Dashboards
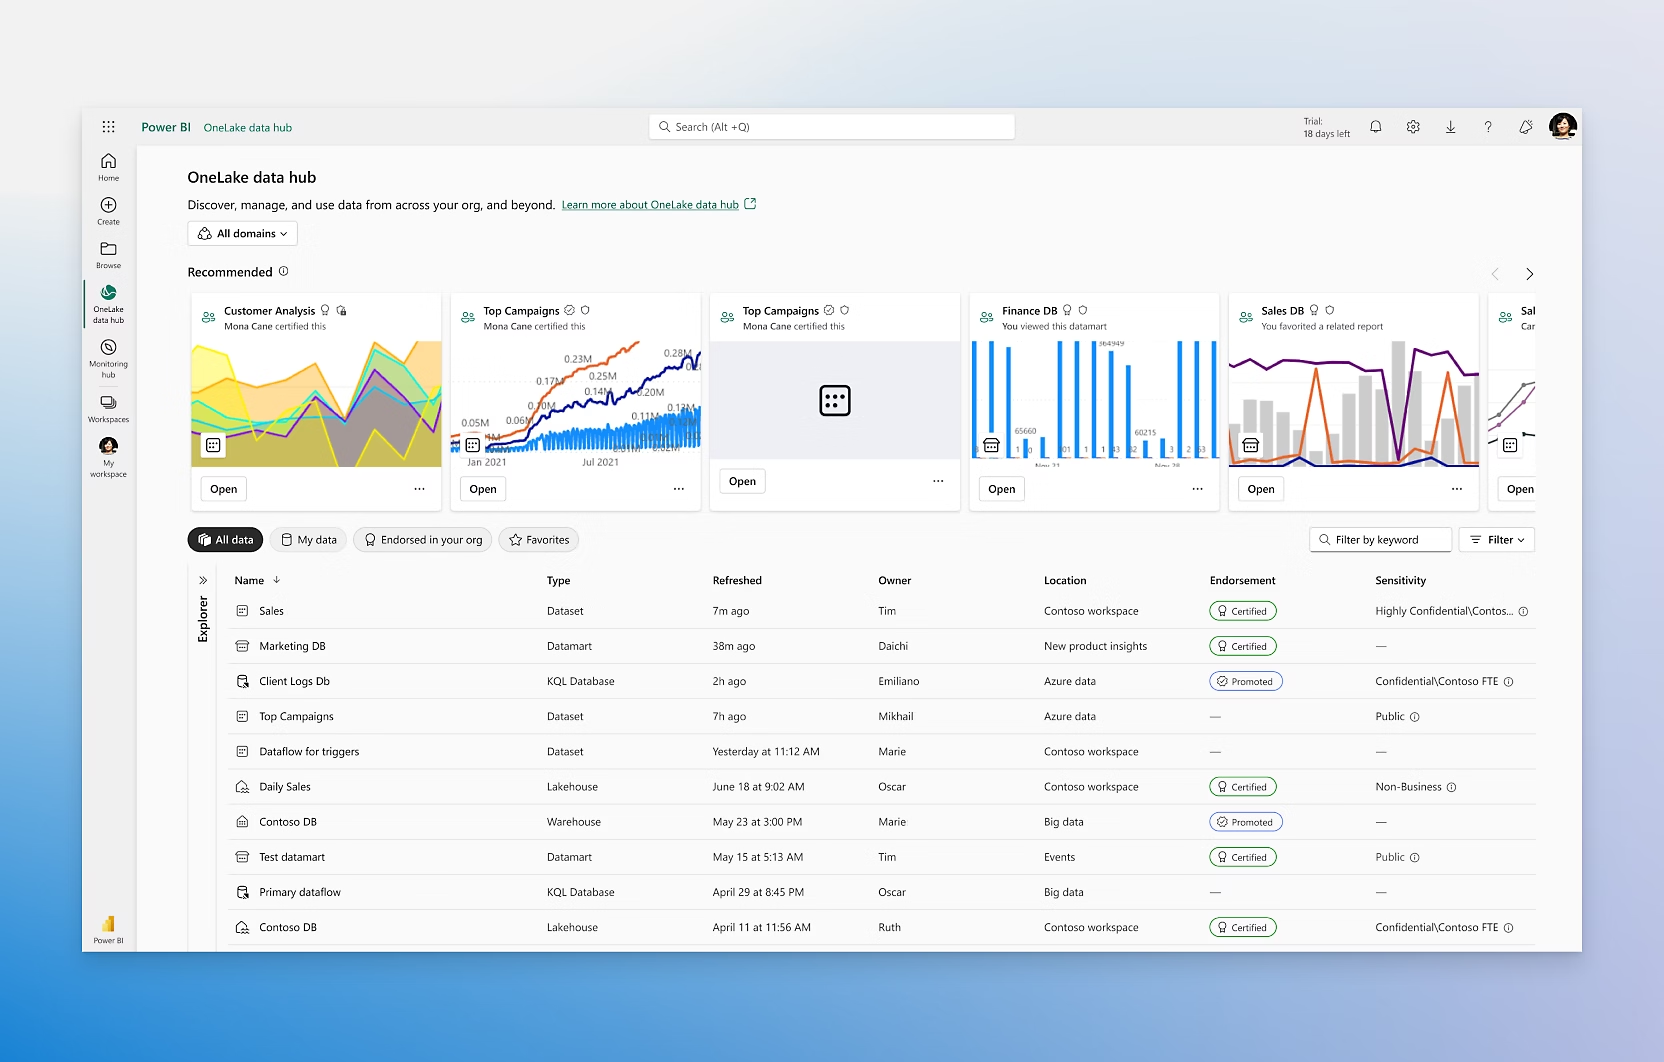
Power BI allows you to create dashboards that suit your needs. You can easily integrate data from Snowflake and other sources to get a comprehensive view.
Pros of Microsoft Power BI
- Easy integration with Snowflake.
- Comprehensive data visualization.
- Free basic version.
- Supports multiple data sources.
Cons of Microsoft Power BI
- May require external help for the initial setup.
- Some advanced features are only available in the Pro version.
Other Supported Databases
- SQL Server
- Azure SQL Database
- Oracle
- MySQL
- PostgreSQL
Microsoft Power BI Pricing
- Free
- Power BI Pro: $10/month per user
- Power BI Premium: $20/month per user or $4,995 per capacity per month
- Power BI Power BI Embedded: Contact Support
Customer Support
- Online documentation and tutorials
- Community forums
- Direct support through Microsoft support
Final Verdict
Microsoft Power BI is another tool for Snowflake data visualization. Its native integration, comprehensive features, and free version make it a valuable business choice. Whether you opt for the free version or upgrade to Pro, Power BI offers powerful data analysis capabilities.
However, Microsoft Power BI may require some knowledge of data analysis, especially for advanced features and custom visualizations.
3. Tableau
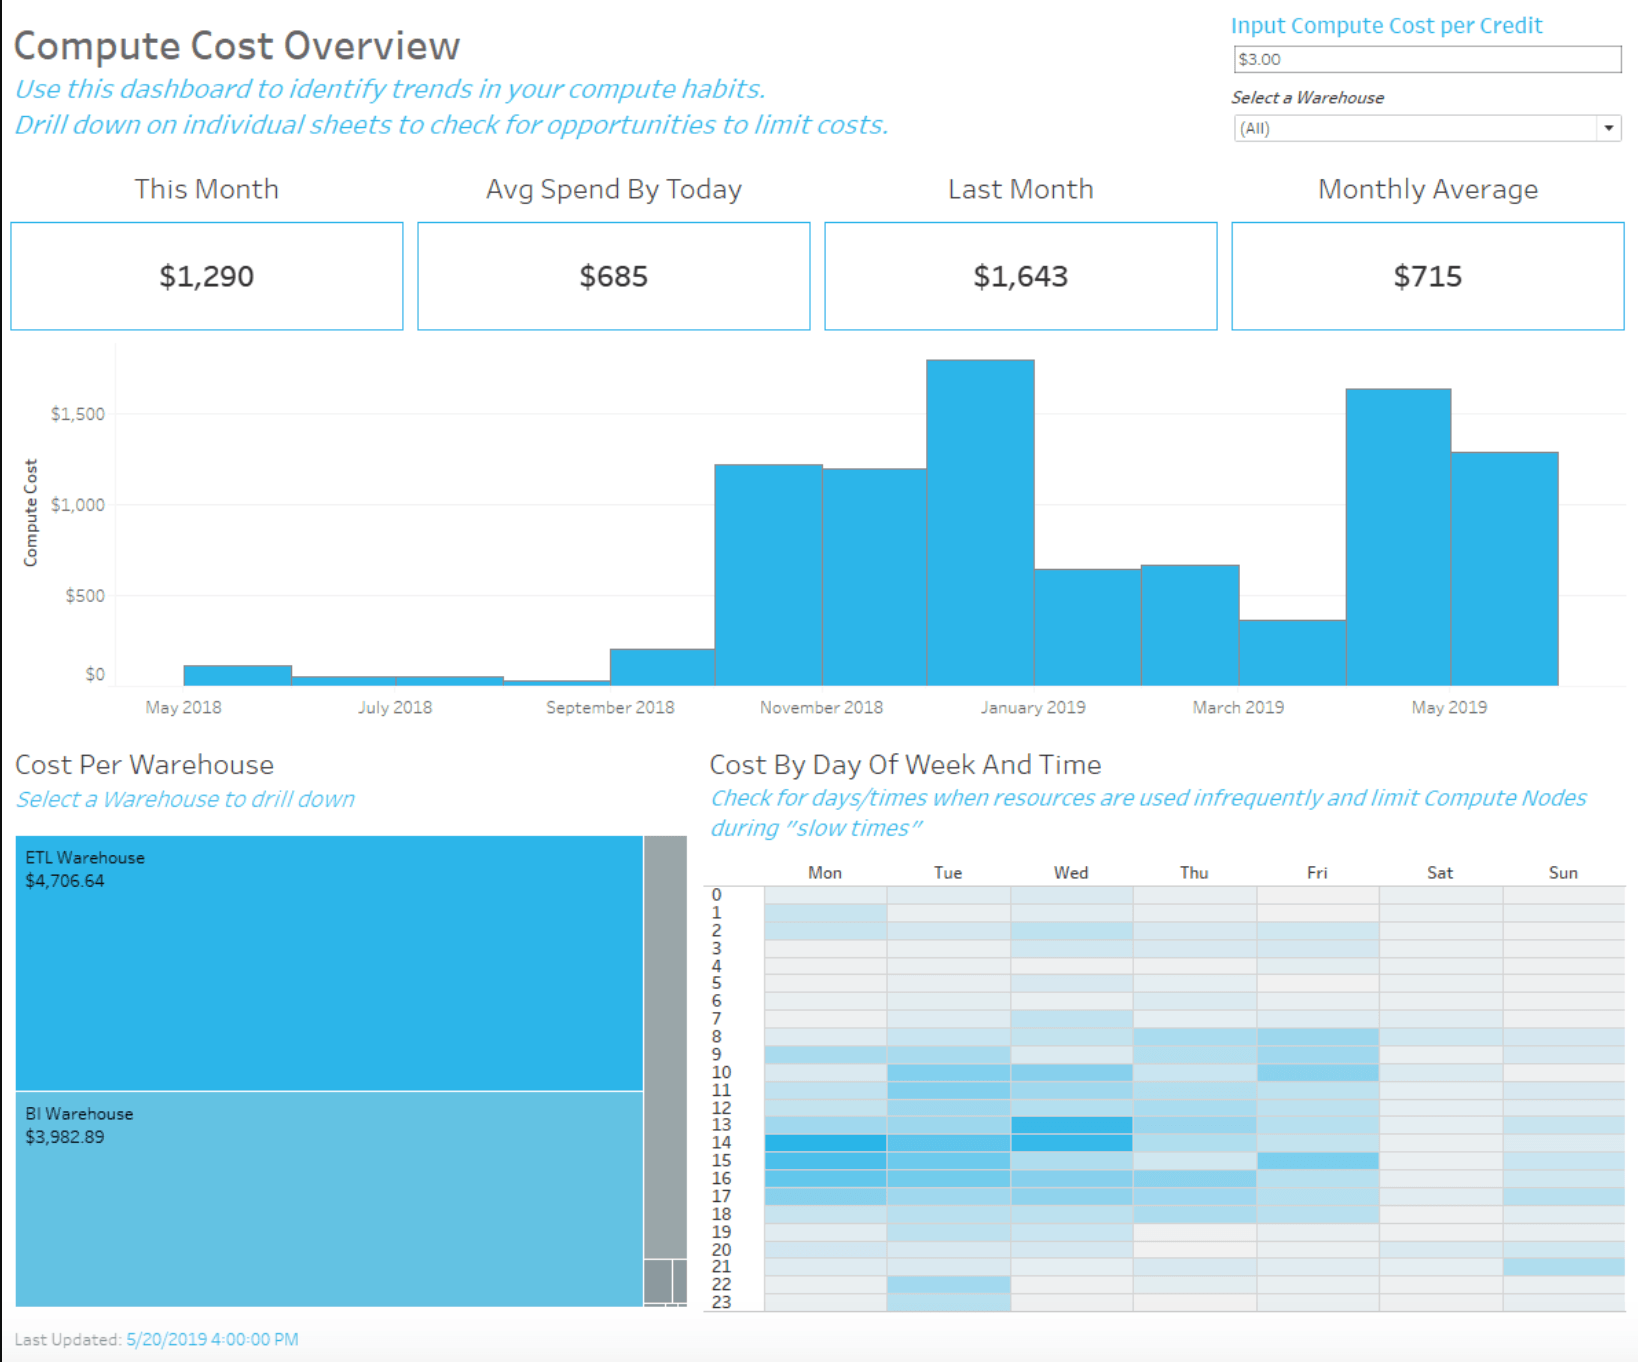
Tableau, our third choice, is a potent data analysis and visualization tool that pairs effectively with Snowflake. It empowers you to craft visually striking representations from your Snowflake data, enhancing its interpretability and utility.
Tableau connects to Snowflake via a dedicated connector. While the setup may require some technical assistance, it enables powerful data visualizations once configured
List of Features
- Integrations with multiple data sources
- Beautiful visualizations
- Search-based analytics
- Cross-database joins
- Alerts and anomaly detection
- Embedded analytics
- Comprehensive customer support
Top 3 Features of Tableau
1. Visualizations
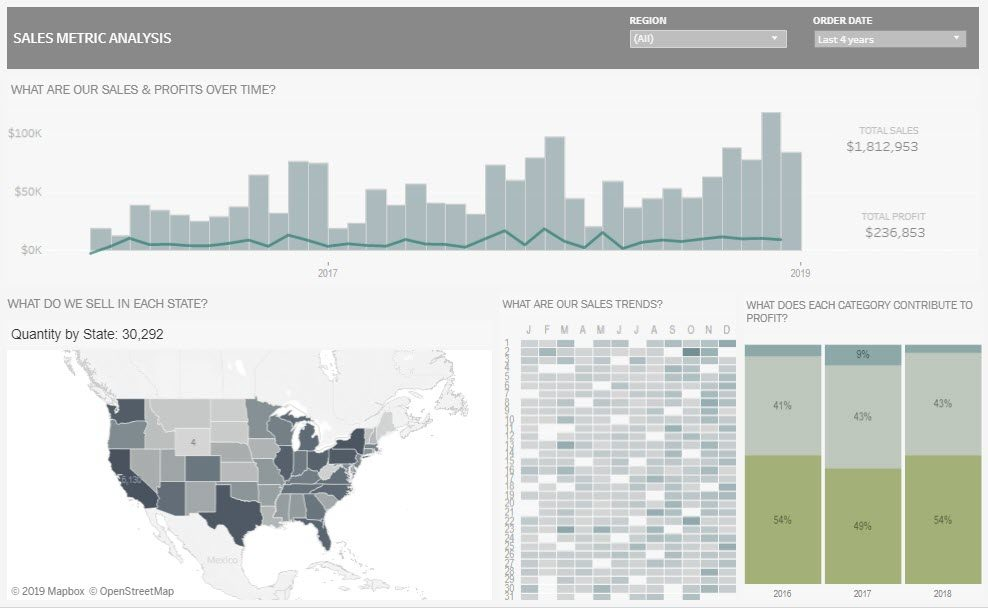
Tableau makes creating stunning charts, dashboards, and maps from your Snowflake data easy. This helps you understand your data better and make informed decisions.
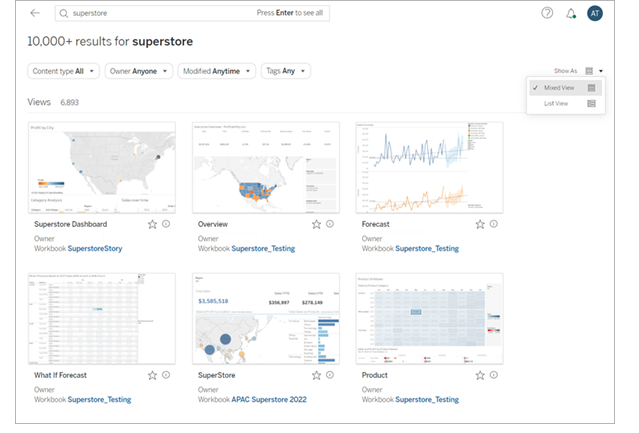
2. Search-based Analytics
With Tableau's Ask Data feature, you can type questions in plain language and get instant visual answers. This is great for non-technical users who need quick insights.
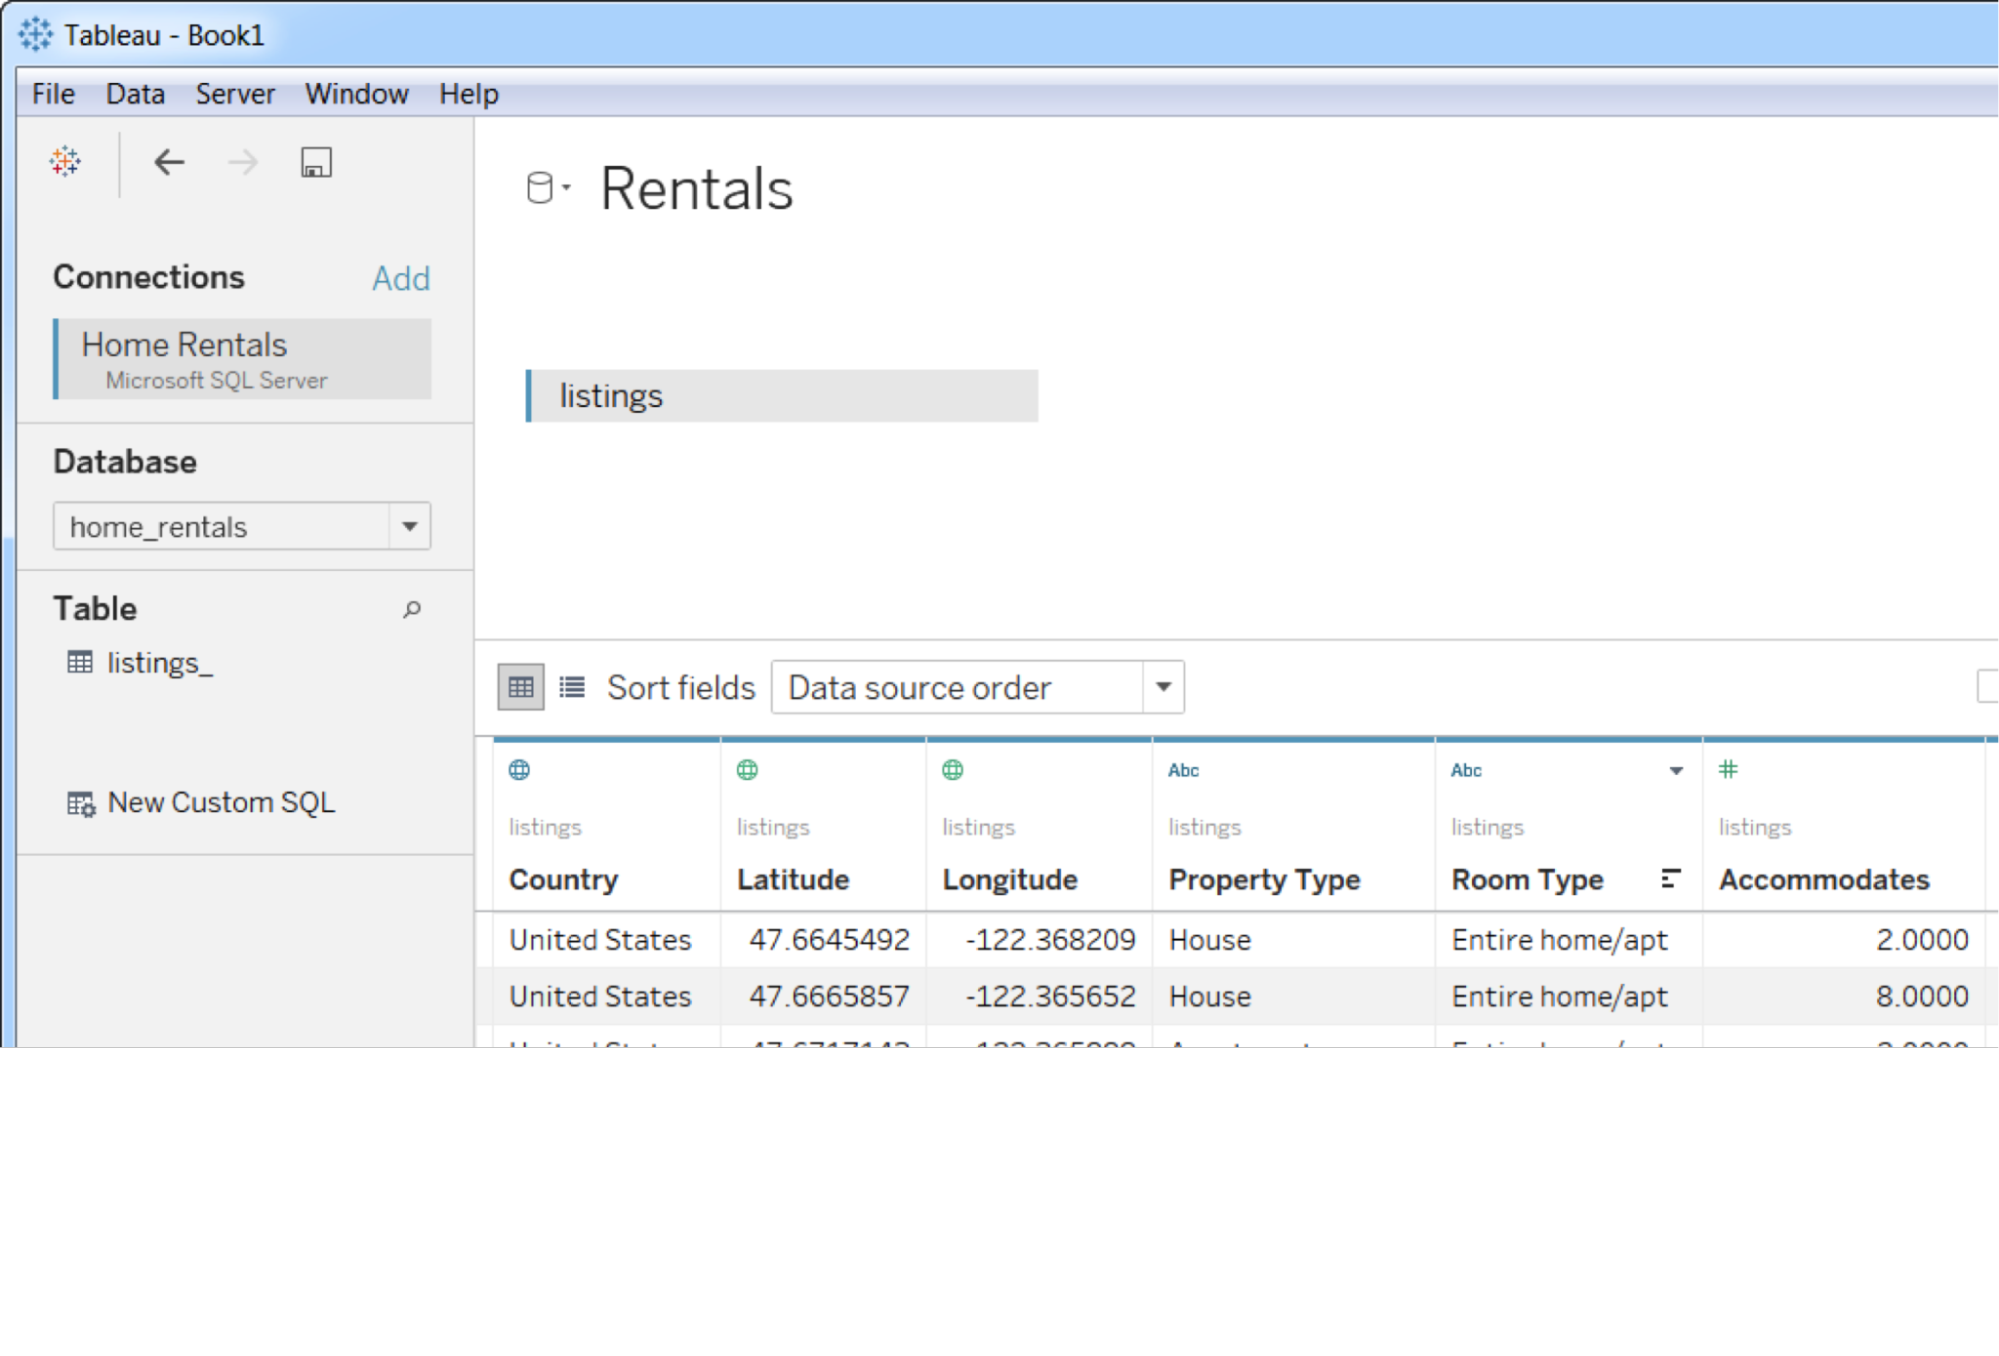
3. Cross-database Joins
Tableau allows you to combine data from different sources easily. You can join data from Snowflake with other databases using simple drag-and-drop actions.
Pros of Tableau
- Integrates well with Snowflake.
- Offers powerful and beautiful visualizations.
Cons of Tableau
- Setting up the connection with Snowflake can be complex.
- Does not support NoSQL data sources directly.
- Limited support for unstructured data.
- Requires structured data and a separate tool for publishing workbooks.
Other Supported Databases
- Snowflake
- Redshift
- Databricks
- BigQuery
- MySQL
- PostgreSQL
Tableau Pricing
- Tableau Creator: $115 per user/month, billed annually
- Tableau Explorer: $70 per user/month, billed annually
- Tableau Viewer: $35 per user/month, billed annually
Customer Support
- Online documentation and tutorials
- Knowledge base with categorized articles
- Community forums
Final Verdict
Tableau is a great choice for Snowflake data visualization. It offers powerful features, beautiful visualizations, and support for multiple data sources. However, it is important to note that Tableau typically requires some level of data analysis knowledge, particularly for setting up and customizing visualizations and dashboards.
4. Datameer
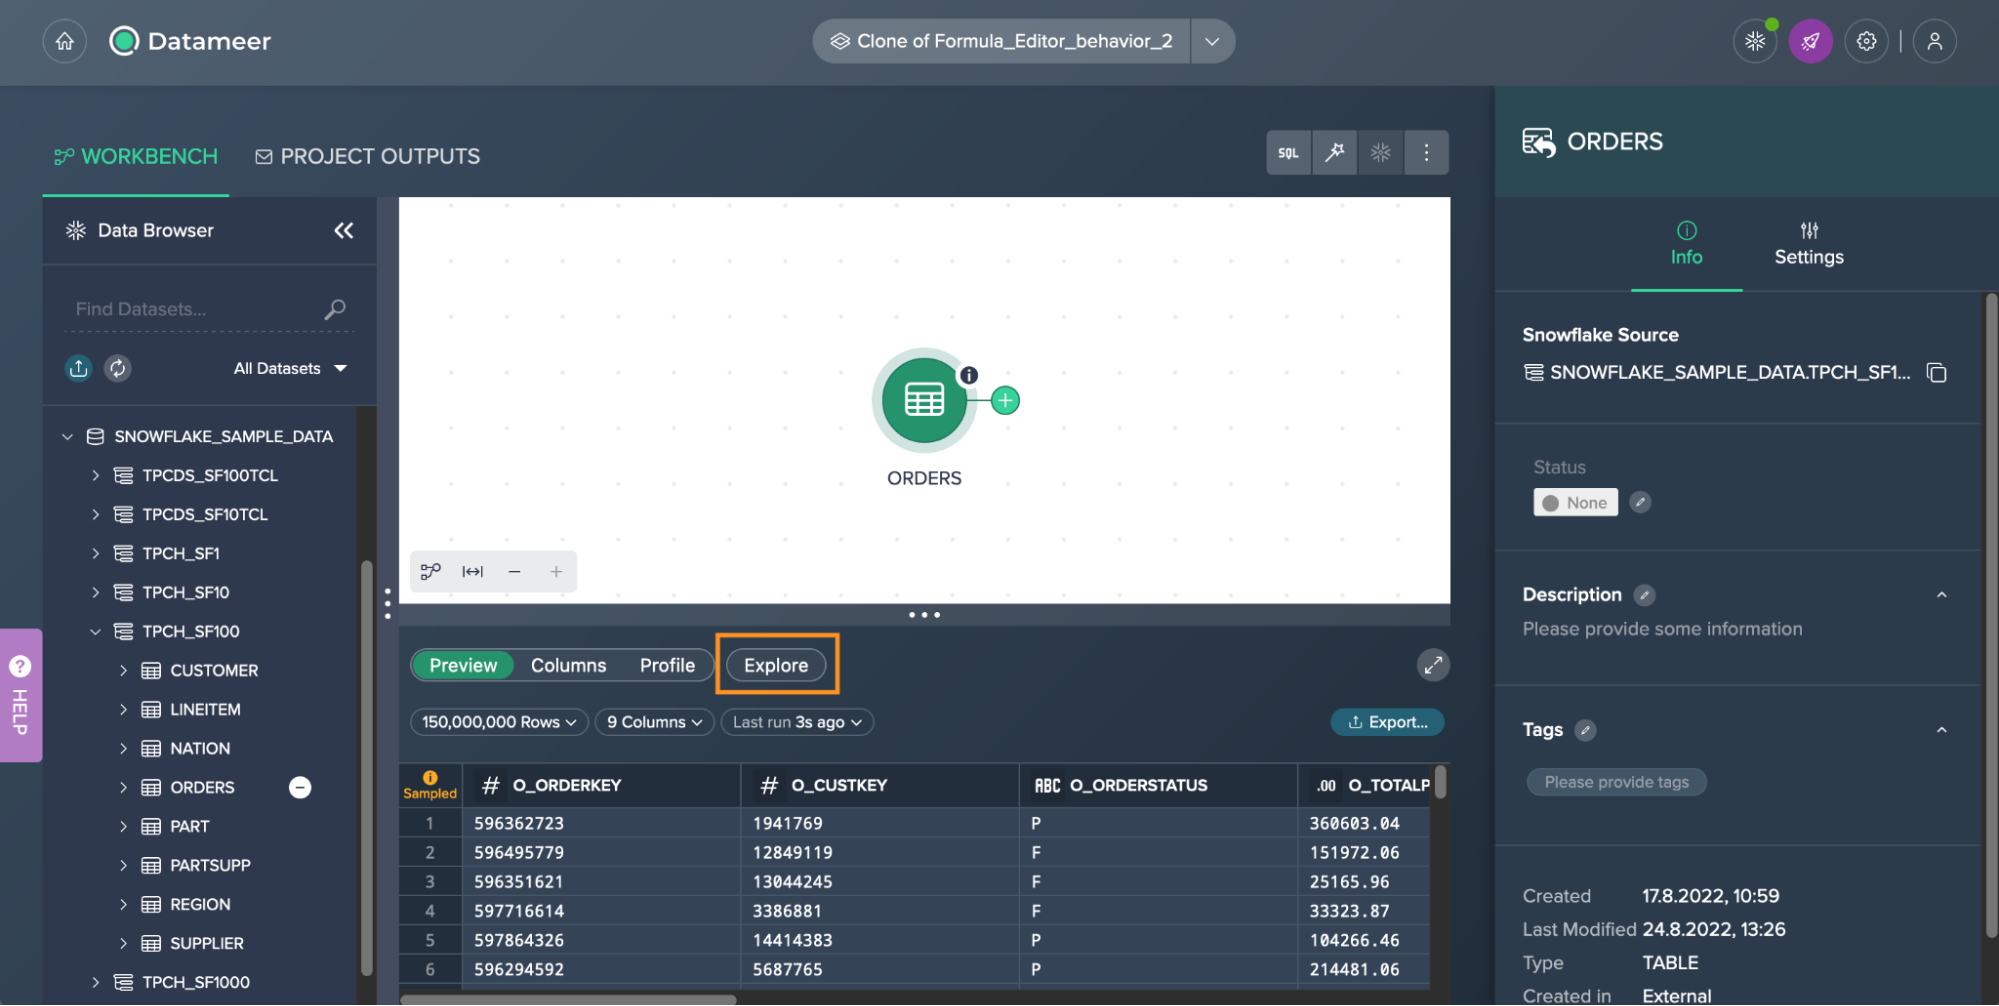
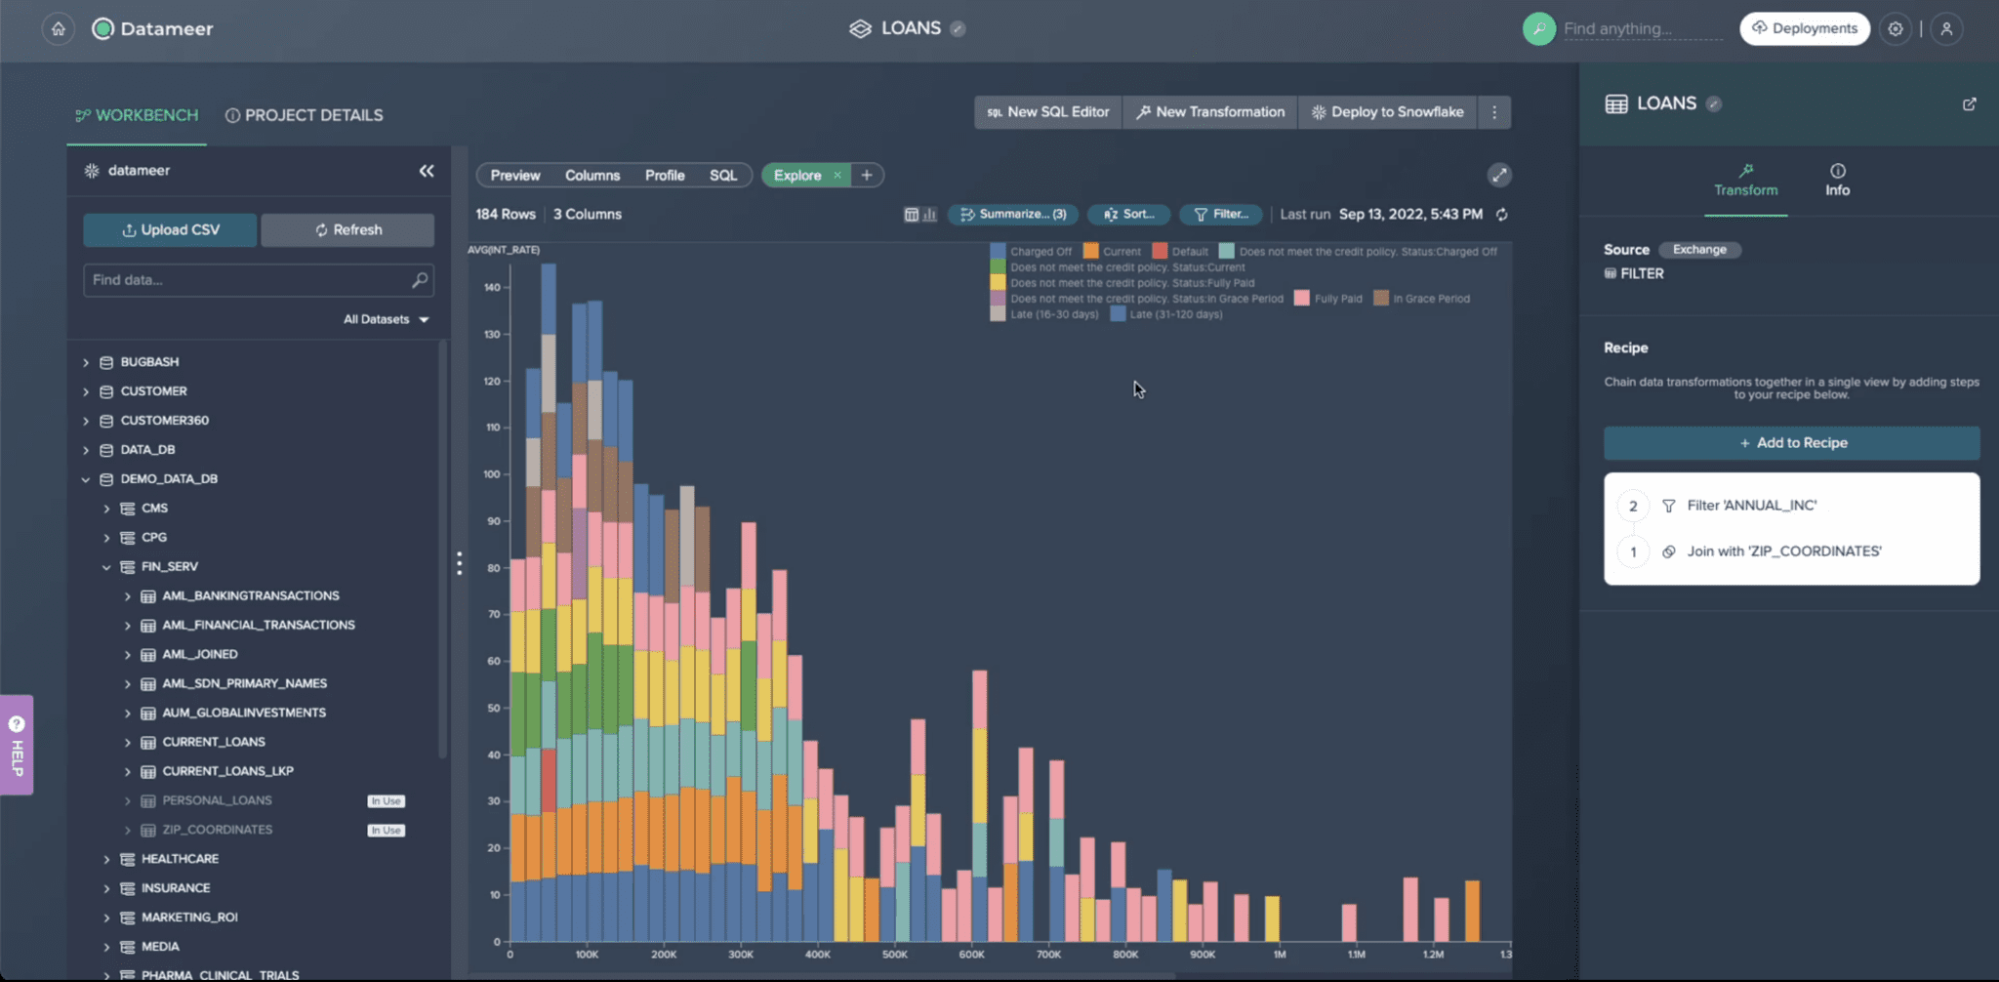
Coming in at number four is Datameer. It is a tool that helps you analyze, visualize, and prepare your data for Snowflake. It’s designed to make working with Snowflake data easy and efficient.
Before you use your BI tool with Snowflake, you must ensure your data is clean and ready. Datameer, a SELECT Snowflake partner, helps you do this by providing tools to prepare your data before you use it in Snowflake.
List of Features
- Data preparation and modeling
- Data visualization
- Built-in Snowflake reporting
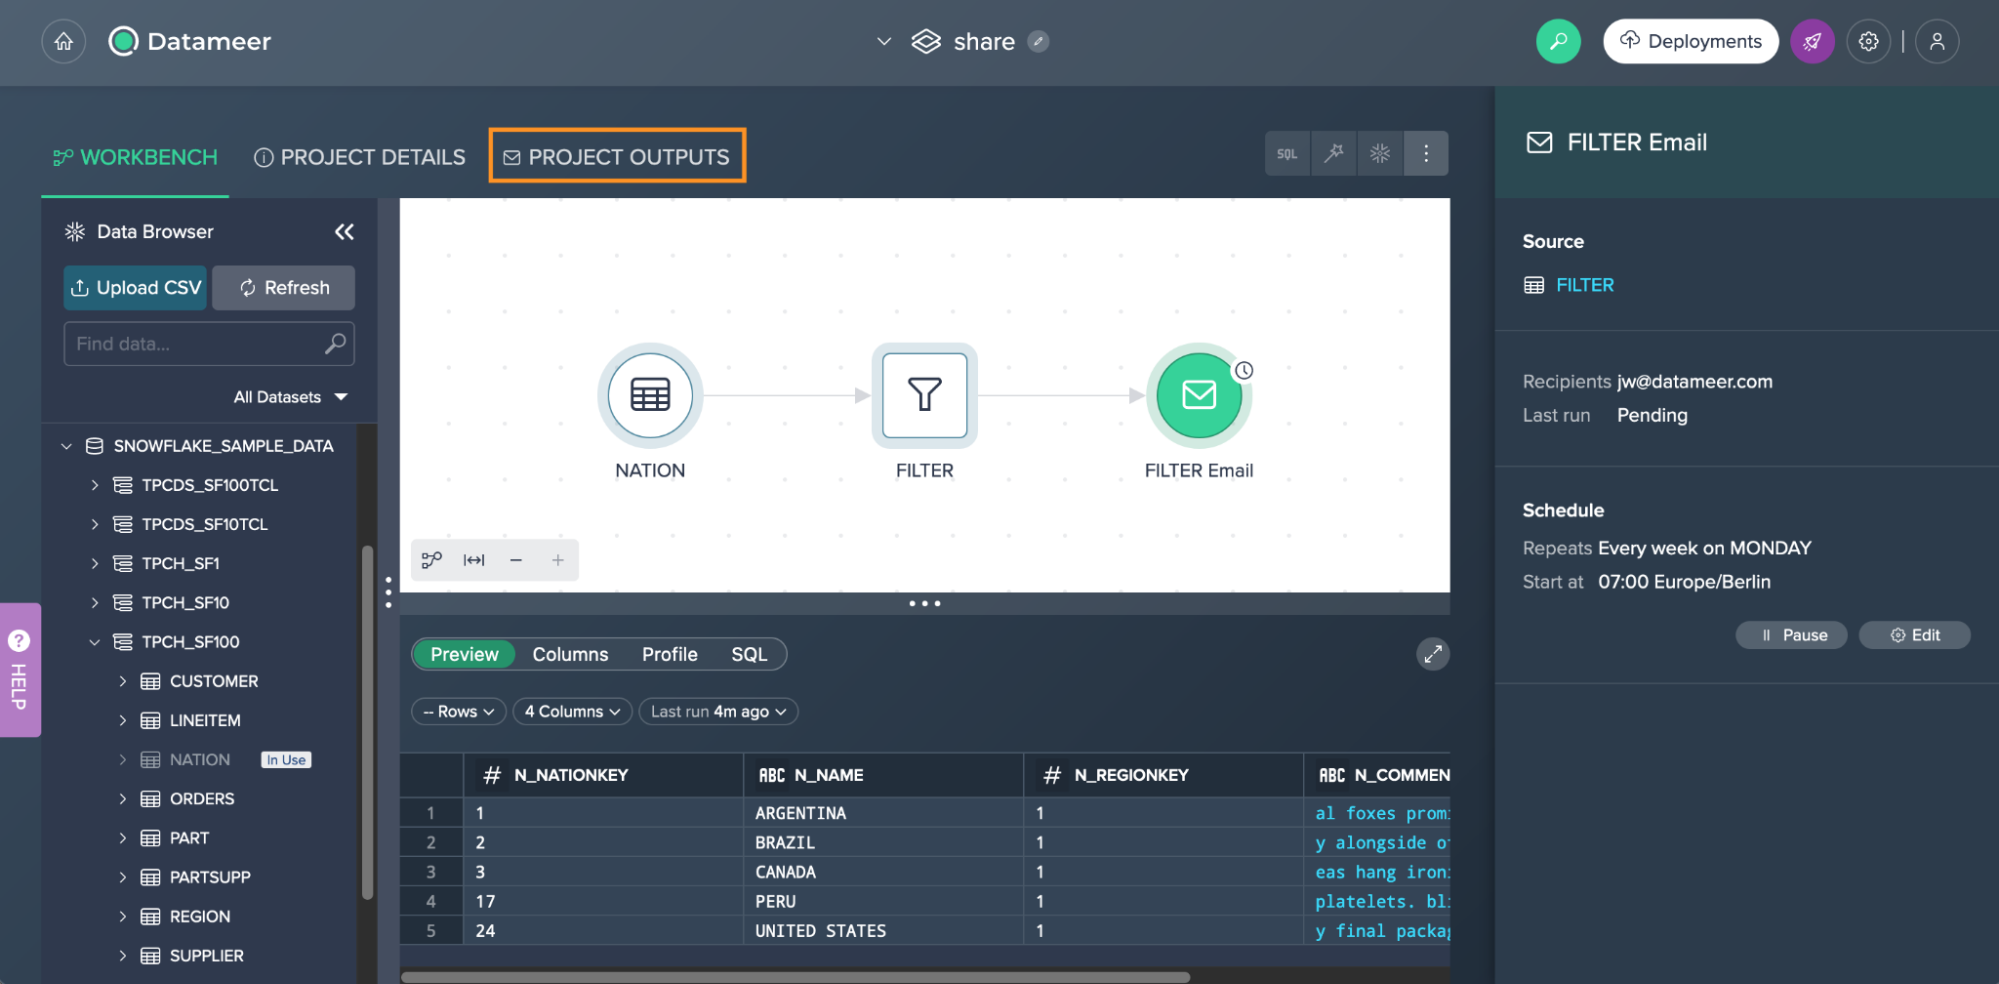
- Schedule and email reports
- Ad-hoc data analysis
- Collaboration capabilities
Top 3 Features of Datameer
1. Data Preparation and Modeling
Datameer helps you clean and prepare your data before using it in Snowflake, ensuring high-quality reports and dashboards.
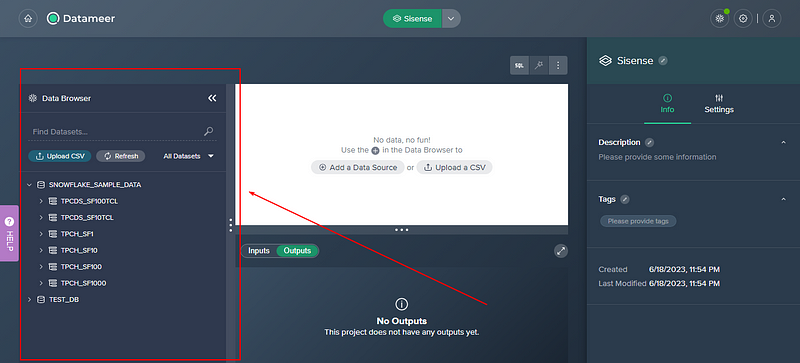
2. Built-in Snowflake Reporting
Easily create reports directly from your Snowflake data sets with Datameer’s built-in reporting tool.
3. Collaboration Capabilities
Work together with your team to analyze and visualize data, making it easier to share insights and make decisions.
Pros of Datameer
- Helps prepare and model data for Snowflake.
- Easy to create and schedule reports.
Cons of Datameer
- Requires initial setup and learning curve.
- May need additional tools for advanced features.
Other Supported Databases
Datameer is only designed to work with Snowflake.
Datameer Pricing
- Datameer offers customized pricing plans.
Customer Support
- Online resources and documentation
- Community forums
- Direct support through their helpdesk
- Demo
Final Verdict
Datameer is a valuable tool for anyone using Snowflake. Its data preparation, visualization, and collaboration features make it easy to manage and analyze your data. While there is a bit of a learning curve, the benefits of using Datameer with Snowflake are significant.
5. Looker Studio
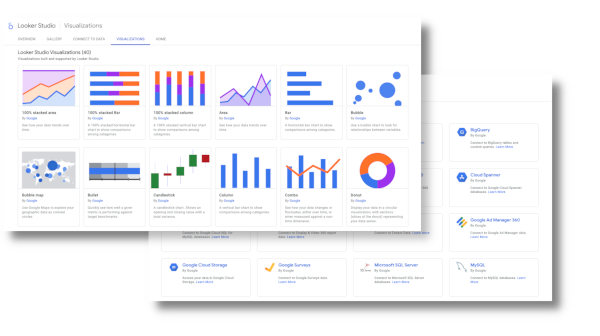
Looker Studio by Google is a business intelligence tool that helps you explore, share, and visualize your data. It's part of Google Cloud and works well with Snowflake.
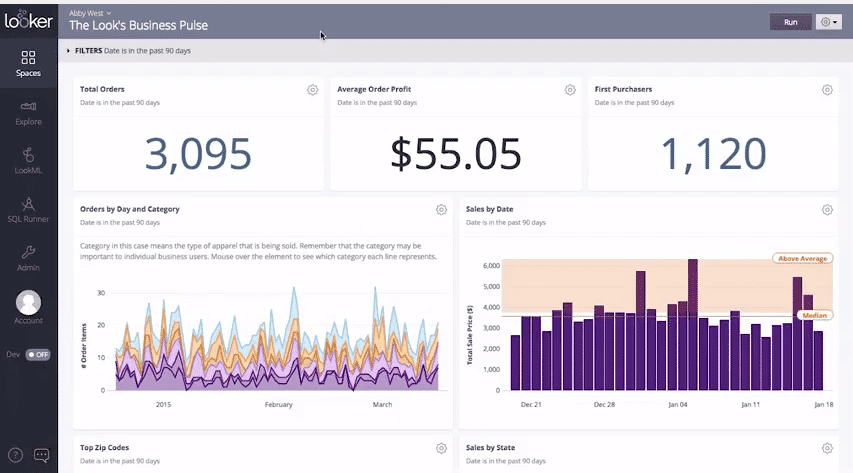
Looker is easy to use and runs entirely in your browser, so you don’t need to install any software. It’s great for creating real-time data reports and dashboards.
List of Features
- Business intelligence and data visualization
- Real-time data exploration
- Browser-based, no installation required
- Integration with Google products
- Supports multiple data sources
- Email scheduling for reports
Top 3 Features of Looker
1. Real-time Data Exploration
Looker lets you explore your Snowflake data in real-time, making it easy to get up-to-date insights quickly.
2. Browser-based
Since Looker runs in your browser, there's no need to install software, making it simple to use and share.
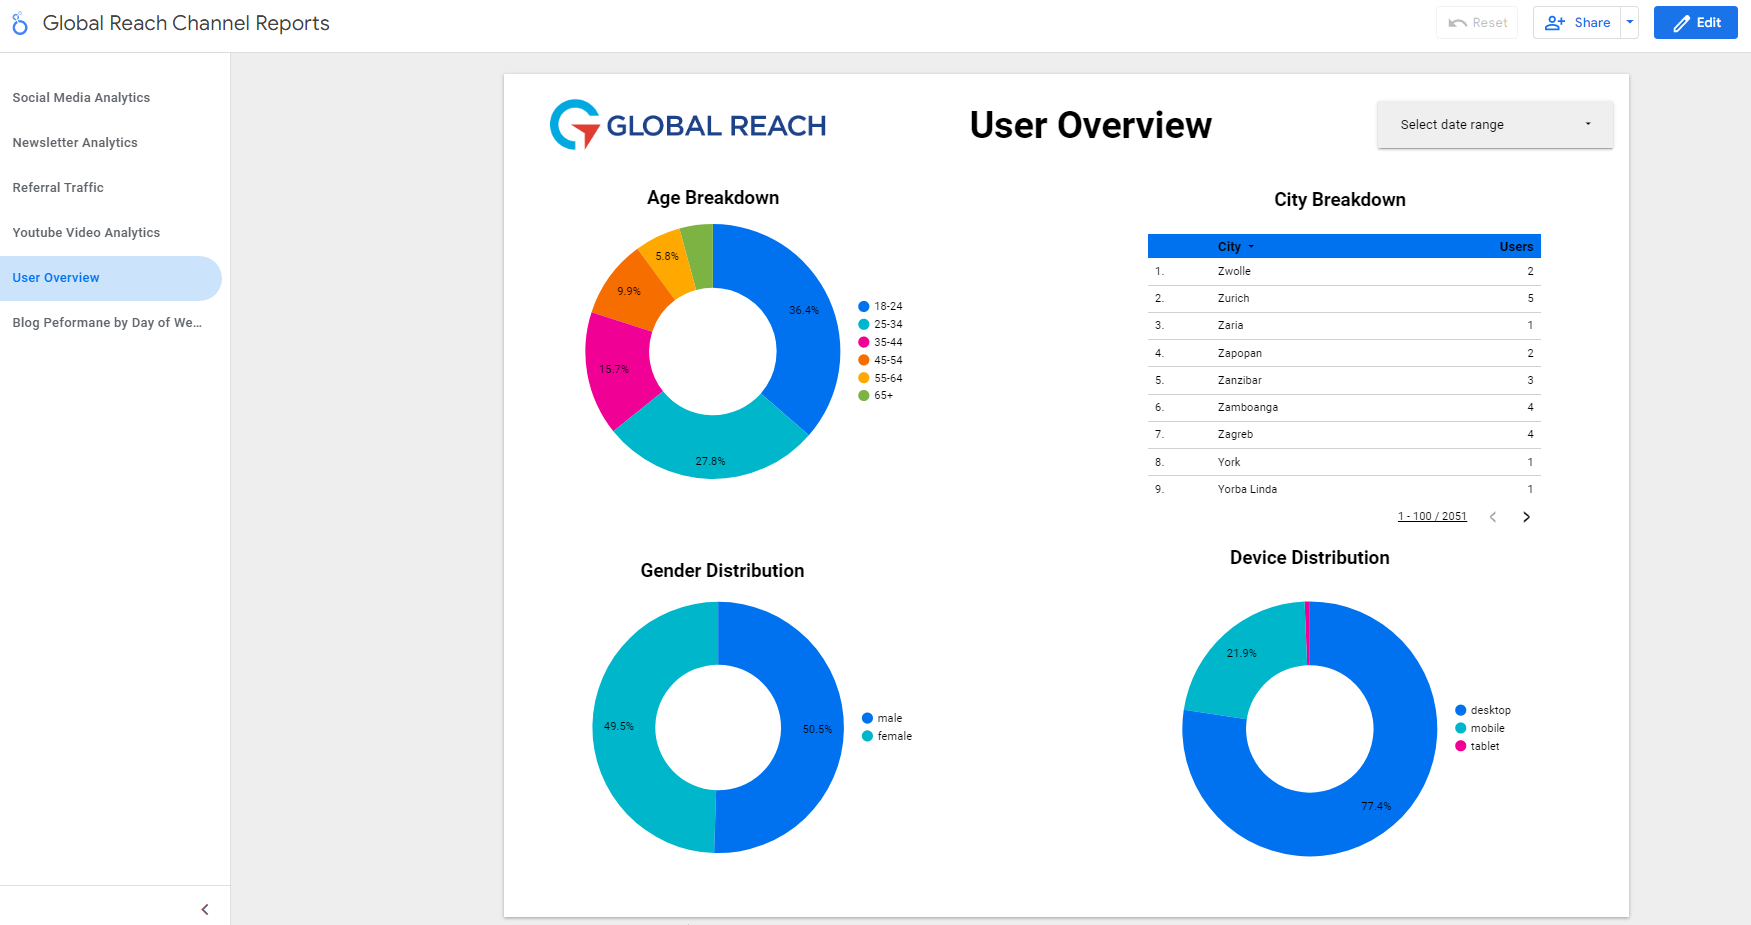
3. Integration with other products
Looker integrates well with 1000’s of other products, enhancing its capabilities for data analysis and reporting.

Pros of Looker
- Easy to learn and use.
- Fully integrated with Google products.
- Runs entirely in the browser.
Cons of Looker
- The least flexible tool on the list.
- No option for custom visuals.
- Requires data to be ready for visualization.
- Uses a new language (LookML), which can be challenging for non-tech users.
Other Supported Databases
- BigQuery
- Vertica
- Redshift
- MySQL
Looker Pricing
Standard Edition:
- Pay as you go: $0.04 per slot hour (billed per second with a 1-minute minimum)
Enterprise Edition:
- Pay as you go: $0.06 per slot hour (billed per second with a 1-minute minimum)
- 1-year commitment: $0.048 per slot hour
- 3-year commitment: $0.036 per slot hour
Enterprise Plus Edition:
- Pay as you go: $0.10 per slot hour (billed per second with a 1-minute minimum)
- 1-year commitment: $0.08 per slot hour
- 3-year commitment: $0.06 per slot hour
Storage Pricing:
- Active logical storage: $0.02 per GiB per month (first 10 GiB free each month)
- Long-term logical storage: $0.01 per GiB per month (first 10 GiB free each month)
- Active physical storage: $0.04 per GiB per month (first 10 GiB free each month)
- Long-term physical storage: $0.02 per GiB per month (first 10 GiB free each month)
Customer Support
- Online documentation
- Community forums
- Direct support options
Final Verdict
Looker Studio is a solid choice as a Snowflake data visualization tool. It offers easy-to-use features, real-time data exploration, and effortless integration with Google products.
Nonetheless, users must have SQL knowledge to get the most of the data they require while working on Looker Studio with BigQuery, which limits non-technical users.
Tools like BlazeSQL ideally assist them by generating SQL codes and queries with AI and even getting the data visualization they are looking for.
Best of the Best: Top 3 Snowflake Reporting Tools
1. BlazeSQL
BlazeSQL is the best tool for Snowflake reporting. It's an AI platform that helps you turn raw data into actionable insights. With BlazeSQL, you can connect your Snowflake database and get real-time data analysis without coding skills.
This makes it perfect for tech and non-tech users, allowing everyone to easily make data-driven decisions. By integrating with Snowflake, BlazeSQL ensures that your data remains secure and accessible, making it a top choice for businesses looking to leverage their data effectively.
2. Microsoft Power BI
Microsoft Power BI is another top pick for Snowflake reporting tools. It offers a robust set of features for data visualization and real-time data analysis. Power BI's integration with Snowflake allows you to access and analyze data from multiple sources, giving you a comprehensive view of your business operations.
This tool helps you make data-driven decisions by providing clear and actionable insights. The self-service analytics feature empowers users to explore data independently, reducing reliance on IT support. Additionally, Power BI's pricing is affordable, making it accessible to businesses of all sizes.
3. Tableau
Tableau is a powerful analytical tool that excels in data visualization and real-time data analysis. It integrates seamlessly with Snowflake, allowing you to pull and visualize data easily. Tableau’s intuitive interface makes it easy to create beautiful charts and dashboards, helping you gain actionable insights from your data.
This tool is ideal for making data-driven decisions across various business functions. One of Tableau's key strengths is its support for self-service analytics. Users can explore data, create reports, and share insights without needing technical skills. However, setting up Tableau with Snowflake may require some technical assistance, but the benefits far outweigh this initial effort.
Conclusion
Choosing among the Snowflake data visualization tools can make a big difference in how effectively you can analyze and use your data. The tools we've discussed offer a range of features to help you turn raw data into actionable insights, supporting real-time data analysis and self-service analytics.
BlazeSQL is the top choice with its user-friendly interface, comprehensive features, and seamless integration with Snowflake. It offers everything you need for real-time data analysis, actionable insights, and data-driven decisions, making it a perfect fit for both technical and non-technical users.
Get started for free today, or book a demo.


