


12 Tableau Alternatives for 2026, Sorted by What You Actually Need

Most "Tableau alternatives" lists just recycle vendor landing pages. We aren't doing that here.
We categorized 12 alternatives by their actual use cases and validated their marketing claims against real user evidence. Whether you're fleeing Salesforce's aggressive renewal pricing, or you're just tired of business users filing a ticket every time they need a basic metric, here is what the landscape actually looks like.
The TL;DR:
- Cost is the trigger, but bottlenecks are the driver. Teams leave because of 3x price hikes, but they stay gone because Tableau's "everyone is an analyst" promise never materialized.
- Power BI is the default, but it's not a silver bullet. It's cheap if you have Microsoft E5, but rewriting logic in DAX is a massive engineering hurdle.
- The AI gap is real. Legacy BI tools bolted chatbots onto old architecture (with mixed results). AI-native tools are finally mature enough to handle ad-hoc business queries reliably.
- Migration scope is usually exaggerated. You probably don't need to rebuild all 200 dashboards. You just need a way for users to ask their own questions.
Not sure which alternative fits your team? Take our quick 2-minute assessment to get a personalized recommendation based on your stack, team size, and priorities.
All 12 Alternatives at a Glance
| Tool | Best For | Starting Price | Non-Technical Friendliness | Migration Difficulty |
|---|---|---|---|---|
| Power BI | Microsoft-heavy orgs cutting costs | $14/user/mo (Pro) | Moderate | High |
| Qlik Sense | Complex, non-linear data exploration | $200/mo (10 users) | Moderate | High |
| BlazeSQL | Self-serve analytics via natural language | ~$400/mo (3 users) | Very High | Low |
| ThoughtSpot | Search-driven analytics | $25/user/mo | High | Low–Moderate |
| Sigma Computing | Teams that think in spreadsheets | Custom (~$300/mo) | Very High | Moderate |
| Looker (Google Cloud) | Centralized governance on GCP | Custom (~$5,000/mo) | Moderate | Very High |
| Domo | All-in-one platform (ETL + BI) | Custom (~$50K/yr) | High | Moderate |
| Zoho Analytics | SMBs on a budget | $24/mo (2 users) | High | Low |
| Metabase | Startups needing quick setup | Free (self-hosted) | High | Very High |
| Apache Superset | Engineering teams wanting control | Free (open source) | Low | Very High |
| Amazon QuickSight | AWS-native organizations | Pay-per-session | Moderate | Moderate |
| Sisense | Embedded / customer-facing analytics | Custom (~$21K/yr) | Moderate | Moderate |
Pricing based on publicly available information as of early 2026. Custom-quoted prices are industry estimates — verify directly with vendors.
Why Teams Are Actually Leaving Tableau in 2026
Before we look at the replacements, we need to look at the root causes. The reasons people cite publicly and the reasons that actually tip the decision aren't always the same.
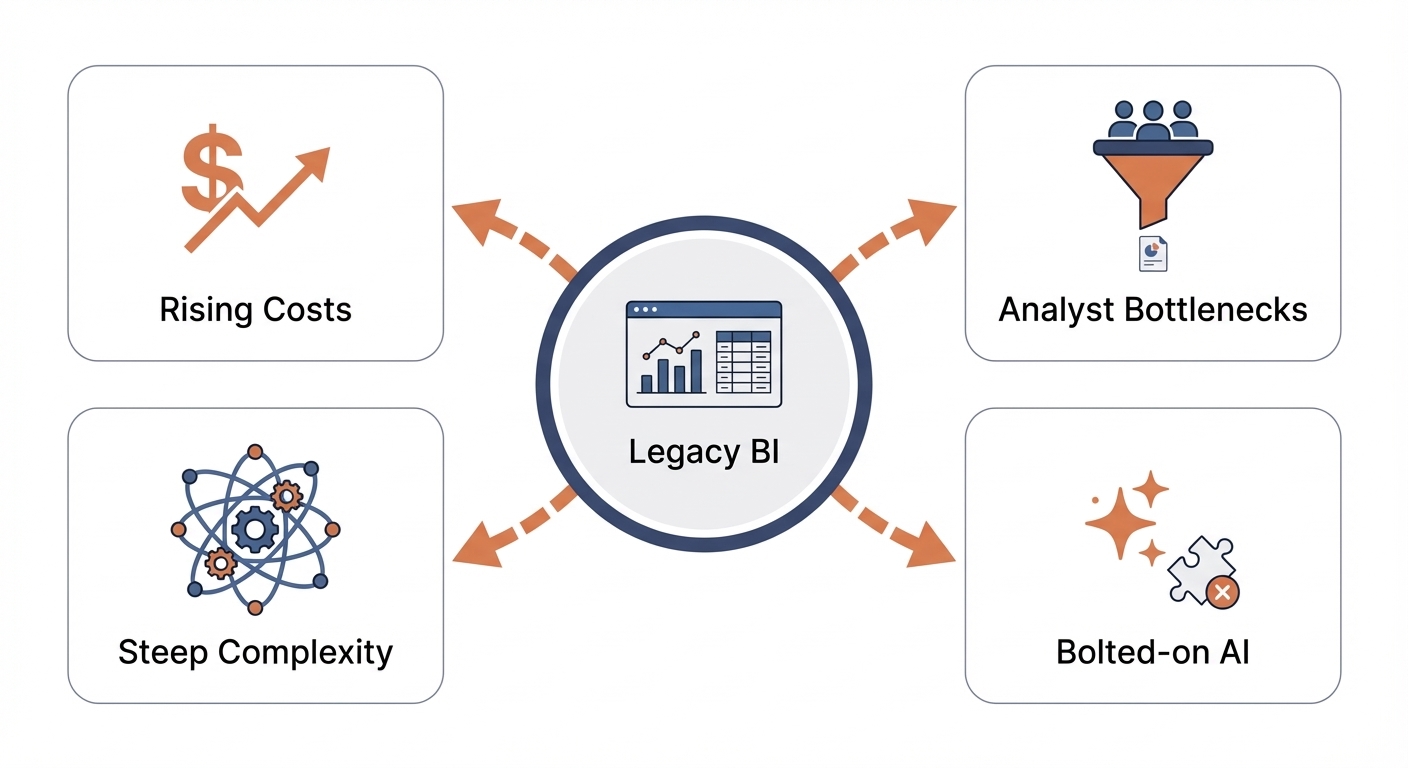
The cost trigger
Price almost always starts the conversation. Tableau Creator licenses run $75/user/month. But the real catalyst was the Salesforce acquisition, which brought aggressive contract renegotiations that caught data teams completely off guard.
This isn't just anecdotal. The University of California, Irvine publicly documented a 75–95% rate increase. That hike kicked off their migration to Power BI—a massive 2.5-year project.
But cost isn't the whole story
When we talk to teams actively evaluating alternatives, three other factors keep surfacing:
- Self-serve never really worked. Tableau promised to make everyone a data analyst. The reality? It requires specialized analysts to build and maintain the views. The second a business user has an ad hoc question, they're back in the IT request queue.
- Speed and complexity. Tableau is incredibly feature-rich, but most teams only use 10% of it. The learning curve is steep, and development cycles for simple tasks are notoriously slow.
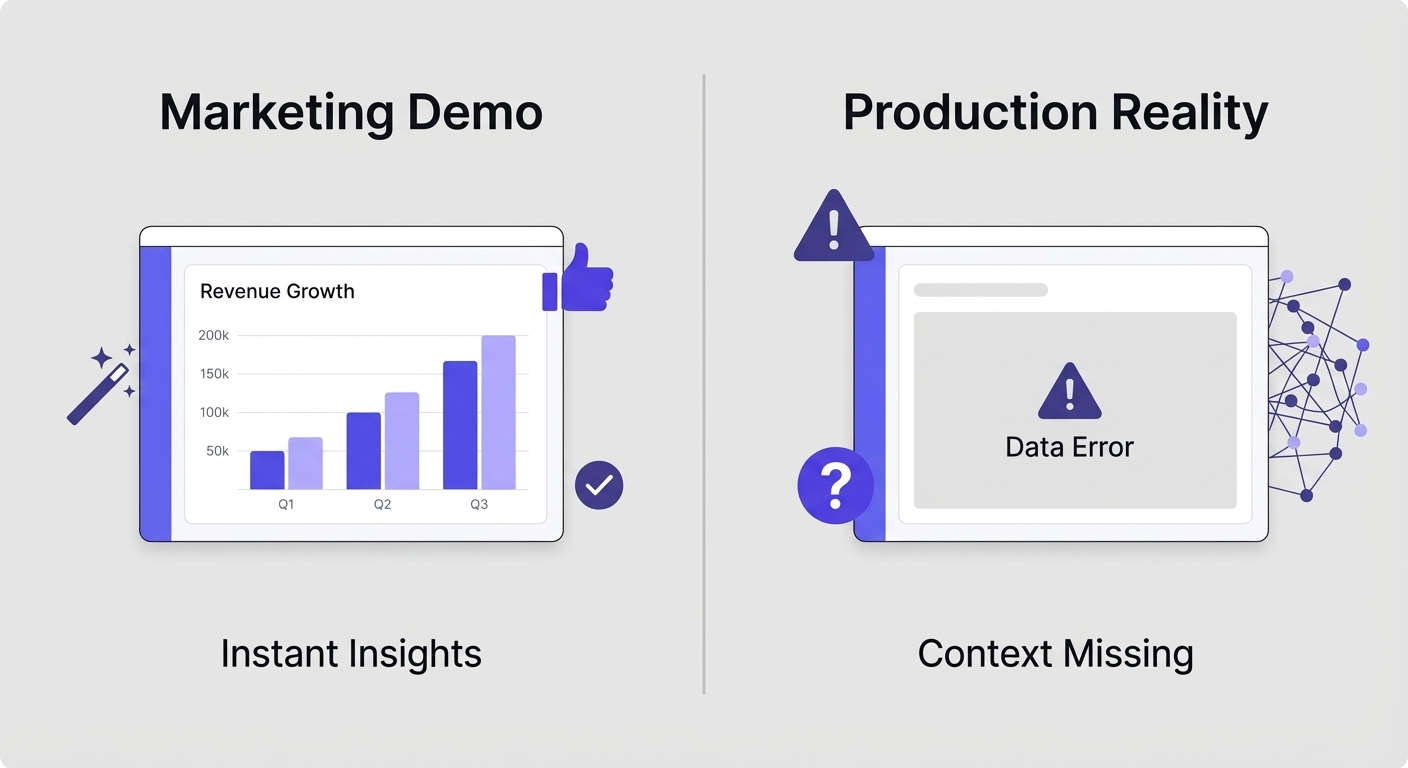
- AI capabilities missed the mark. Tableau markets features like Pulse and Einstein Copilot heavily. But long-time users consistently report they were rushed to market. The gap between a slick AI demo and reliable production use is still incredibly wide.
The 12 Best Tableau Alternatives
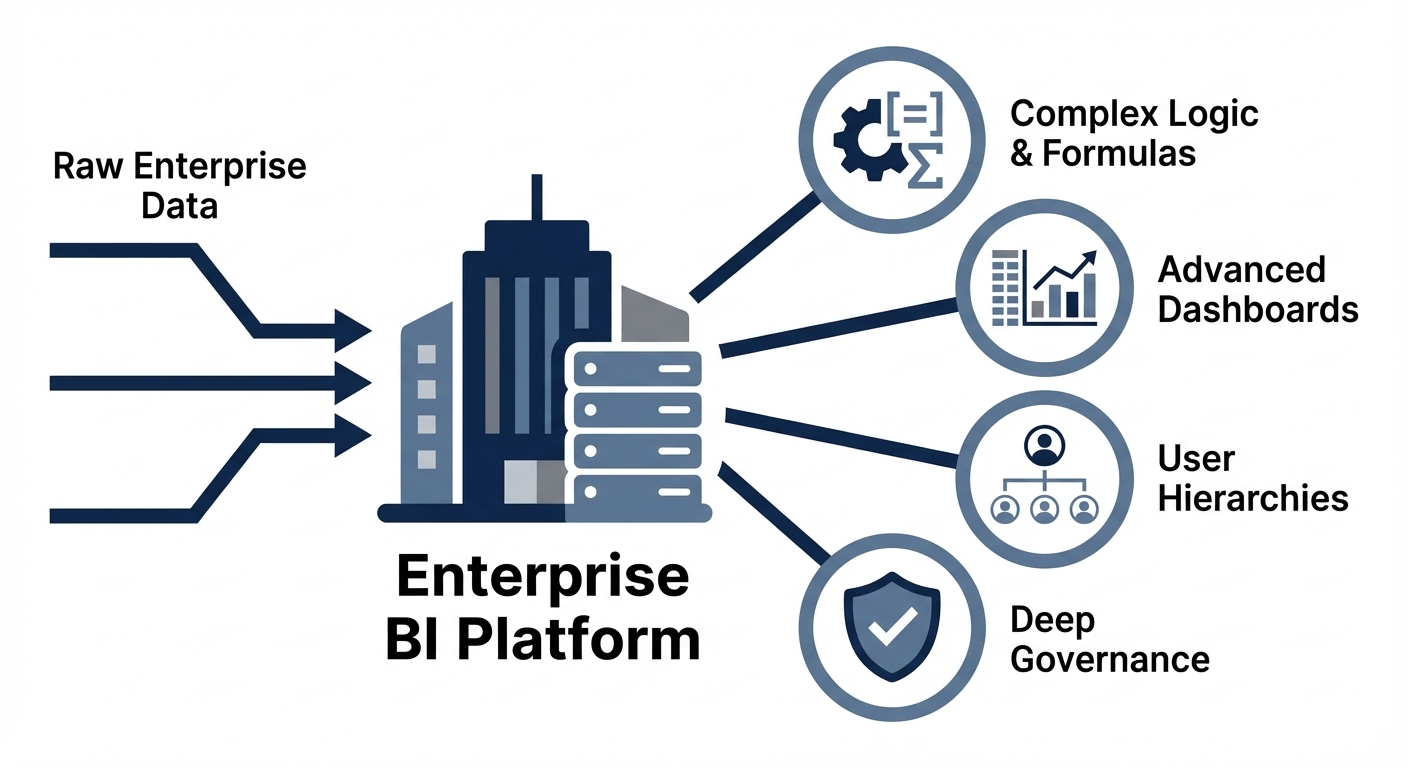
Enterprise BI Platforms
These are the traditional heavyweight replacements. If you are doing a like-for-like enterprise migration, these are your default options. They are incredibly powerful, but you will trade one set of complexities for another.
Power BI
Power BI is the most common destination for Tableau refugees. The math is simple: if your org pays for Microsoft 365 E5, Power BI Pro is effectively included.
Key strengths: Unmatched integration with Excel, Azure, and Dynamics. The VertiPaq engine handles data modeling brilliantly. At $14/user/month for Pro, the baseline cost is hard to beat.
Key limitations: DAX (the formula language) is brutally difficult to master. Premium/Fabric capacity pricing scales up violently. And if you want pixel-perfect, highly customized visual branding, you'll miss Tableau.
Best for: Microsoft-heavy organizations looking to drastically cut per-user BI costs, provided you have analysts willing to learn DAX.
Qlik Sense
Qlik operates differently than anything else on this list. Its associative engine doesn't force you into predefined queries. Instead, you click any value and instantly see how it relates across your entire data model.
Key strengths: The in-memory associative engine is genuinely unique. It handles complex, messy data models natively without requiring heavy upstream transformations.
Key limitations: Pricing is opaque (you'll need to talk to sales). Qlik scripting has a steep learning curve. The UI feels noticeably dated next to modern tools.
Best for: Teams doing complex, non-linear data exploration where users don't know exactly what question they are trying to answer until they start digging.
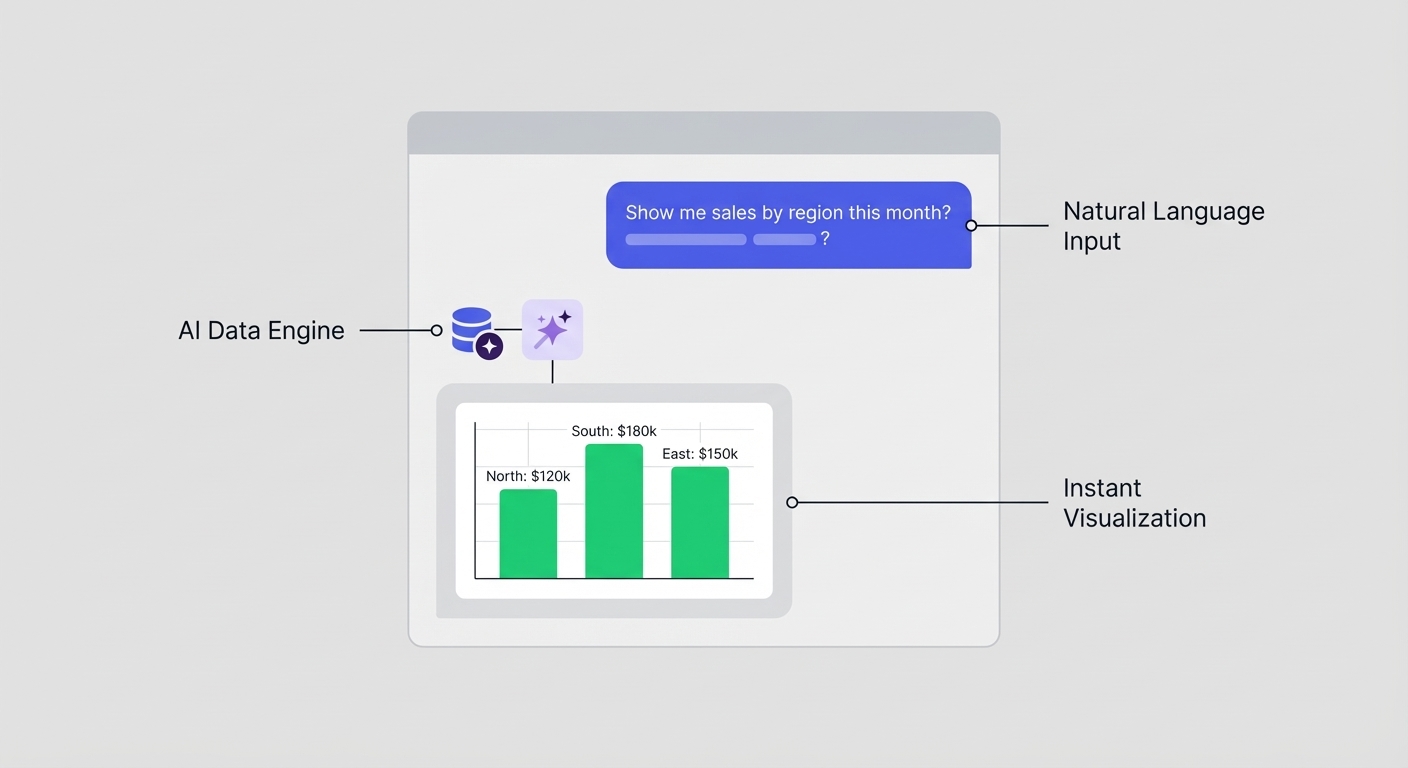
AI-Native BI Platforms
This category represents a fundamental shift in how we interact with data. Instead of building endless dashboards, users ask questions in plain English.
Key insight: There is a massive difference between legacy tools that bolted on a chatbot, and tools built entirely around an AI workflow. Native tools focus on reliability and accuracy; bolted-on tools focus on demos.
BlazeSQL
BlazeSQL connects directly to your SQL databases or warehouses. Users ask questions in plain English; the platform generates the SQL, runs it, and hands back tables, charts, and dashboards.
Key strengths: It's built for production reliability. It includes a knowledge base to store your specific business logic, learns passively from query corrections, and gives technical users a review interface. Non-technical users get actual self-serve; analysts stop writing the same SELECT statements every week.
Key limitations: You won't get the pixel-perfect visual formatting of Tableau. There is no fully air-gapped on-premise deployment (though a desktop app keeps results local). Not meant for embedded customer-facing use cases.
Best for: Teams paralyzed by the analyst bottleneck. If your main issue is that business users can't get basic answers without help, this solves it directly.
ThoughtSpot
ThoughtSpot essentially invented "search-driven analytics." You type into a search bar, and Spotter (their AI assistant) returns relevant charts based on your underlying data.
Key strengths: Excellent enterprise governance. Purpose-built for search. They also offer an automated Tableau-to-ThoughtSpot migration tool.
Key limitations: It requires heavy upfront data modeling to work. If your data isn't perfectly structured, the search fails. Users often still need to know the exact names of database fields to get reliable answers.
Best for: Data engineering teams with the resources to build and maintain the rigorous data models required to make search work at scale.
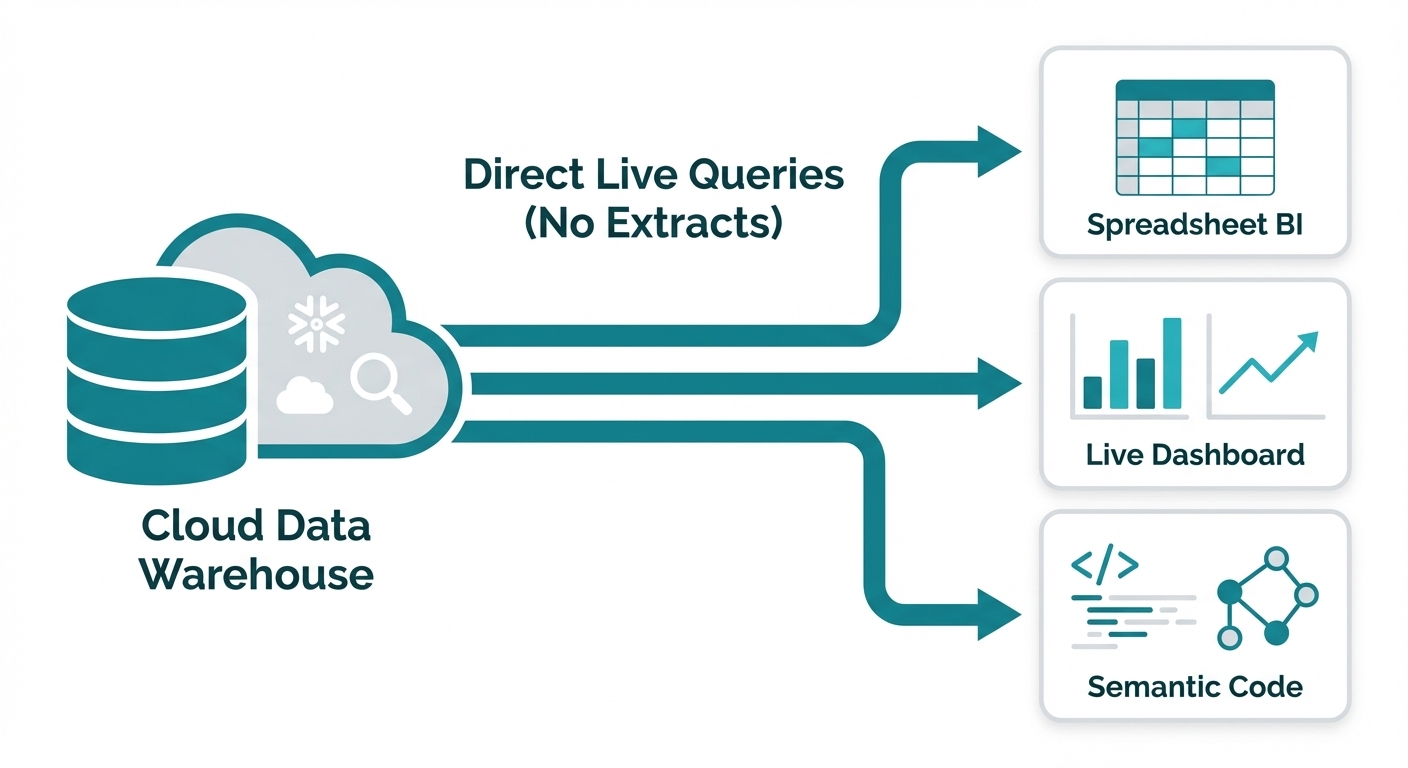
Cloud-Native and Modern BI
These tools skip the traditional "extract" phase entirely. They query your cloud data warehouse (Snowflake, BigQuery, Redshift) directly, leveraging the compute you are already paying for.
Sigma Computing
Sigma looks and acts exactly like a spreadsheet. But instead of breaking at 1 million rows, it translates your spreadsheet actions into live queries against your cloud warehouse.
Key strengths: Zero learning curve for anyone who knows Excel. No data extracts. It also features write-back capabilities, which is huge for budgeting and forecasting workflows.
Key limitations: Visualizations are basic compared to Tableau. It's a newer ecosystem with less community support. You absolutely must have a modern cloud data warehouse to use it.
Best for: Organizations heavily invested in Snowflake or BigQuery where business users are already comfortable doing their analysis in Excel.
Looker (Google Cloud)
Looker enforces total centralized control. All business logic is defined in code (LookML) and version-controlled with Git. It completely eliminates the "we have 10 dashboards with 10 different definitions of revenue" problem.
Key strengths: The best semantic layer and governance in the industry. Incredible integration if you are already on Google Cloud / BigQuery.
Key limitations: It requires dedicated LookML engineers. It is extremely expensive (starts around $5,000/month). It is terrible for business users who just want to explore data freely.
Best for: Engineering-led organizations that value absolute metric consistency over broad user self-service.
Domo
Domo is the whole stack in a box. It handles data ingestion, ETL, storage, and visualization inside one platform.
Key strengths: Massive connector library (1,000+). You don't need a separate data warehouse. You can stand it up incredibly fast.
Key limitations: Very high cost (enterprise deals routinely start around $50K/year). Deep vendor lock-in because your data lives inside Domo.
Best for: Mid-market companies that don't have a modern data stack yet and just want to buy their way into a complete solution immediately.
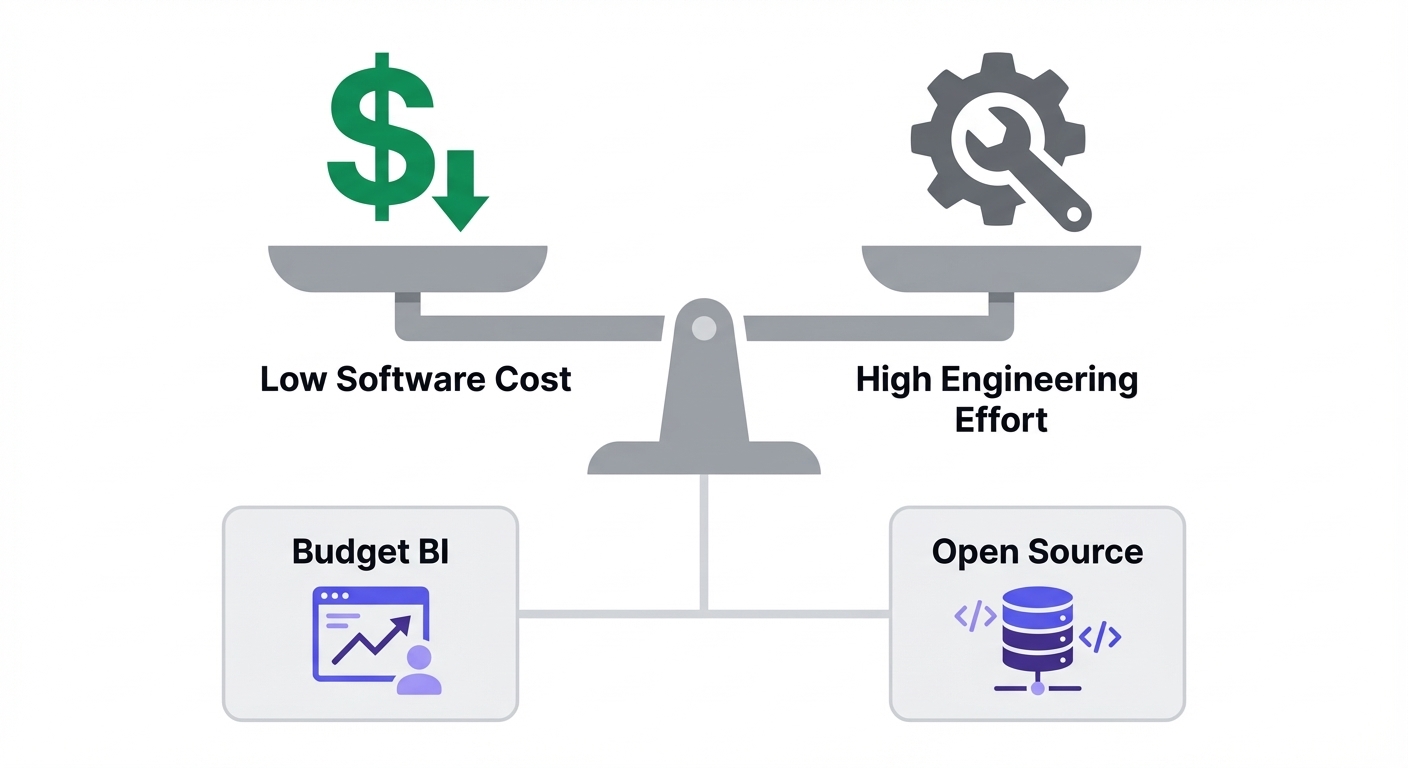
Budget-Friendly and Open Source
If cost is your only real metric—whether you're a lean startup or an enterprise bleeding cash—these options cut your software bill to near-zero. You just pay in engineering hours instead.
Zoho Analytics
Zoho is the most overlooked tool in the BI space. It is remarkably capable for small businesses, integrating beautifully with the rest of the Zoho suite while costing a fraction of enterprise tools.
Key strengths: Unbeatable pricing ($24/month for 2 users). Low learning curve. Built-in natural language querying via Zia.
Key limitations: It will choke on enterprise data volumes. Advanced analytical features are limited. Visuals are basic.
Best for: SMBs who need functional reporting without the six-figure enterprise overhead.
Metabase
Metabase is the default choice for early-stage startups. The open-source version is free to self-host, and the UI is so simple that anyone with basic SQL knowledge can build a dashboard in minutes.
Key strengths: Unrivaled time-to-value. Free. Incredibly intuitive visual query builder.
Key limitations: Visualizations are rigid. It struggles badly with complex multi-table joins and advanced logic. It lacks enterprise governance features.
Best for: Startups and lean teams that need charts immediately and have zero budget for BI software.
Apache Superset
If you want power without the license fee, Superset is the answer. It plugs directly into the modern data stack (dbt, Airflow) and scales beautifully.
Key strengths: Totally free. Highly customizable. Handles massive datasets easily if configured right.
Key limitations: You need a dedicated engineering team to deploy and maintain it. There is zero self-serve capability for business users. It lacks Tableau's slick cross-filtering and drill-down features.
Best for: Engineering-heavy teams that want total control over their infrastructure and don't care about business user self-serve.
Cloud Provider and Embedded Specialists
These tools serve highly specific architectural needs. Don't buy them for general BI; buy them because they fit your exact deployment model.
Amazon QuickSight
QuickSight is AWS's native BI layer. Its biggest advantage is the pricing model: you pay per session, not per user.
Key strengths: Flawless AWS integration (Redshift, S3, Athena). Session pricing ($0.30/session) is incredibly cheap for audiences that only check dashboards once a month. Fully serverless.
Key limitations: Data prep and visual polish trail far behind Tableau. Amazon Q (their AI add-on) is expensive and gets mixed reviews. It's a poor choice if you aren't already on AWS.
Best for: AWS-native companies with thousands of casual, infrequent dashboard viewers.
Sisense
Sisense isn't really for internal use. It is built from the ground up to be white-labeled and embedded inside your own software product.
Key strengths: The best embedded, white-label analytics in the market. Developer-first API architecture.
Key limitations: Pricing is complex. The UI is built for engineers, making it a poor fit for internal business analysts.
Best for: SaaS companies that want to sell an "Analytics" module to their own customers without building it from scratch.
What Migration From Tableau Actually Looks Like
Most comparison guides completely ignore the reality of migration. You aren't just buying new software; you are translating years of business logic. Based on case studies and user reports, here is what you are actually signing up for.
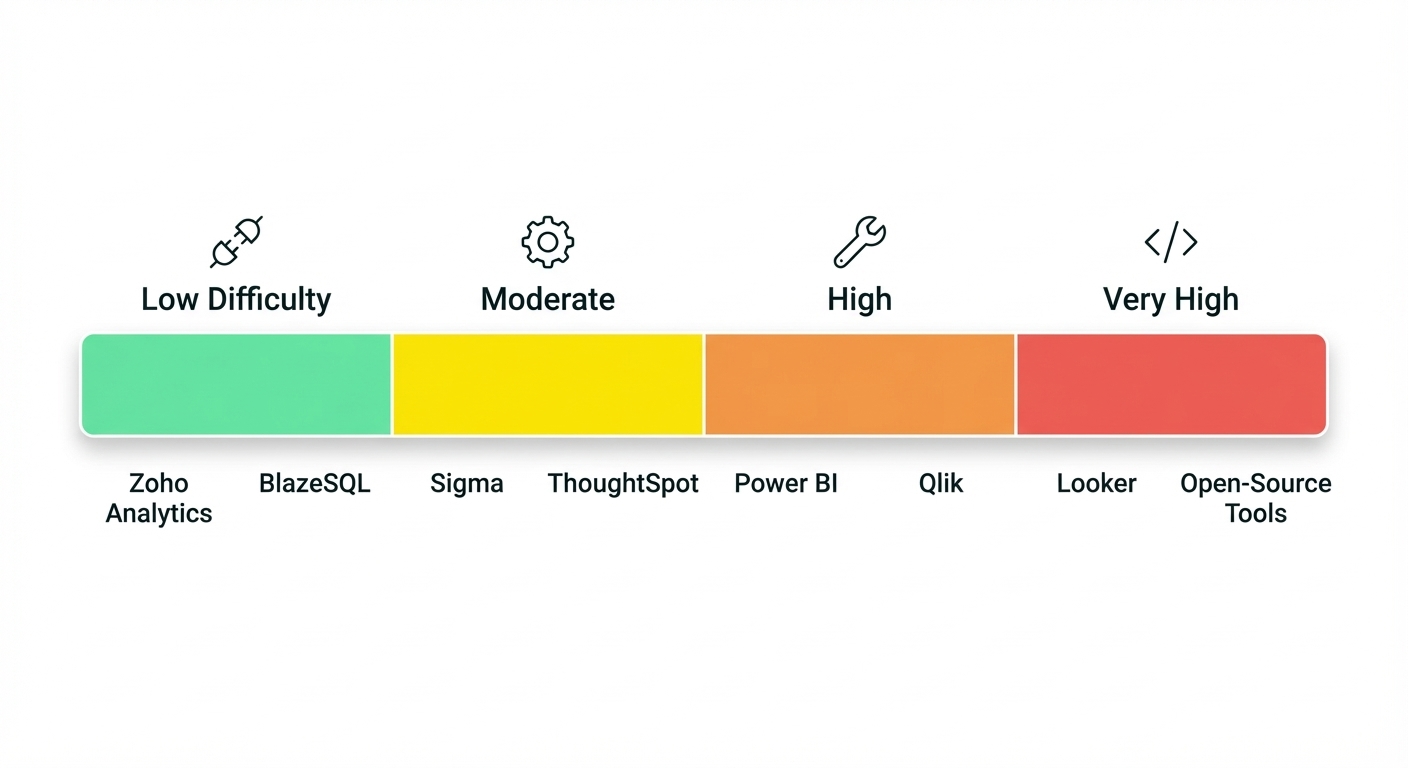
| Target Platform | Difficulty | The Main Challenge |
|---|---|---|
| BlazeSQL | Low | Connects to your existing DB. No dashboard rebuild required — many teams find they need fewer dashboards. |
| Zoho Analytics | Low | Simple import process, but limited advanced feature parity. |
| ThoughtSpot | Low–Moderate | Offers a migration tool, but complex Tableau features don't transfer. |
| Sigma Computing | Moderate | Mindset shift from extracts to live warehouse queries. |
| Domo | Moderate | Both data pipelines and dashboards move into Domo's ecosystem. |
| QuickSight | Moderate | Dashboard rebuild required; AWS-native connectors ease data access. |
| Sisense | Moderate | Focus is on rebuilding embedded workflows and API integrations. |
| Power BI | High | Converting LOD expressions to DAX is the biggest hurdle. Star schema re-engineering often needed. |
| Qlik Sense | High | Data models must be adapted for the associative engine. Qlik scripting is its own learning curve. |
| Looker | Very High | Entire logic layer must be rewritten in LookML. Fundamentally different paradigm. |
| Metabase | Very High | 100% manual rebuild. Most advanced Tableau features don't exist. |
| Apache Superset | Very High | 100% manual rebuild. Data transformations must move to dbt or similar. |
What this means: The biggest mistake teams make is trying to do a 1:1 migration.
When you audit your Tableau instance, you will likely find that 60% of your dashboards haven't been viewed in months. The migration forces a cleanup.
If you have 50 highly complex, mission-critical dashboards, moving to Power BI is a massive engineering project. But if those dashboards only exist because users had no other way to ask questions, moving to a natural-language tool reduces your migration scope from "rebuild everything" to "connect the database."
The AI Question: What Works vs. What's Marketing
Every vendor is currently selling the dream of AI analytics. Here is the pragmatic reality, sourced directly from user evidence and testing.
- Power BI Copilot: Great for basic DAX templates and report summaries. It falls apart on complex queries. More importantly, it requires Premium/Fabric capacity, and users report a ~20% spike in compute costs when it's active.
- ThoughtSpot Spotter: The search functionality works, but it is fragile. If your data model isn't flawless, or if the user doesn't use the exact alias for a column, results degrade quickly.
- Tableau Pulse / Einstein Copilot: Paywalled behind higher tiers. Long-time users are widely skeptical, calling the early implementations rushed and underwhelming.
- Qlik Answers: Very little independent validation exists yet. The core engine is great, but the generative AI wrapper is unproven in the wild.
The pattern is clear
Bolt-on AI does not work for business intelligence. You cannot slap an LLM on top of a 15-year-old dashboarding architecture and expect it to magically understand your company's definition of "Active Churn."
Tools built natively around AI are a different story. Because their entire product relies on natural language, they invest heavily in the unsexy backend stuff: context management, business logic glossaries, and query review loops. If you want AI that actually returns accurate data, look for native architecture, not a feature add-on.
Try this: The fastest way to cut through AI marketing is to demand a live test on your own messy database, not their sanitized demo data.
Still weighing your options? Our 2-minute assessment matches your specific needs — stack, team size, technical maturity — to the alternatives most likely to work for you.
How to Pick the Right Alternative
At the end of the day, your choice depends entirely on which bottleneck you are trying to solve.
- If your primary pain is cost: Look at Power BI, Zoho Analytics, or open-source tools like Metabase.
- If your primary pain is non-technical self-serve: Look at BlazeSQL, ThoughtSpot, or Sigma.
- If you need absolute metric governance: Look at Looker.
- If you are embedding in your own SaaS product: Look at Sisense.
Factor in your existing stack:
- Heavy Microsoft footprint? Power BI is the obvious path.
- GCP / BigQuery? Looker or Sigma.
- AWS? QuickSight.
- Standard SQL databases / Stack agnostic? BlazeSQL, Metabase, or Superset.
Factor in migration tolerance:
- Can't afford downtime? BlazeSQL or Zoho.
- Willing to endure 6-12 months of engineering for long-term fit? Power BI, Looker, or Qlik.
There is no objectively "best" Tableau alternative. There is only the tool that aligns with your data structure and your team's capabilities. The worst thing you can do is spend a year migrating to a new platform, only to recreate the exact same bottlenecks you have right now.
Salesforce came back late last year and said cost was going to almost 3x and force the push to cloud so all licenses would need to be Creator rather than Desktop for development. That kind of put the final nail in the coffin.
View on Reddit