


14 Best Automated Reporting Tools Compared (2026)

Most automated reporting fails. Not because the cron job breaks, but because the numbers are wrong, the signal is buried in noise, or the dashboard just rots in a stakeholder's inbox.
The market has split into distinct categories that serve fundamentally different use cases. Marketing agencies need white-labeled PDFs. Enterprise data teams need governed semantic layers. And right now, every single vendor claims to have "AI capabilities" (spoiler: most of them are faking it).
This guide cuts through the vendor marketing. I've broken down 14 tools across four distinct categories, complete with real pricing, honest trade-offs, and a pragmatic framework to help you choose.
TL;DR:
- The market has 4 distinct segments: Marketing/Client tools, AI-Native platforms, Traditional BI, and Open-Source/SMB. Knowing your segment eliminates 75% of your research.
- Most "AI" in BI tools is just bolted on. Look for platforms built natively around natural language, not a chatbot slapped onto a legacy dashboard.
- The real bottleneck isn't scheduling. It's data trust. If a tool doesn't help you maintain your unique business logic, the automation is useless.
- Don't build this yourself. Unless your use case is incredibly narrow, the maintenance burden of a DIY Python script will eventually crush your team.
Not sure which solution is right for your needs? Take our quick 2-minute assessment to get personalized recommendations.
What Automated Reporting Tools Actually Do
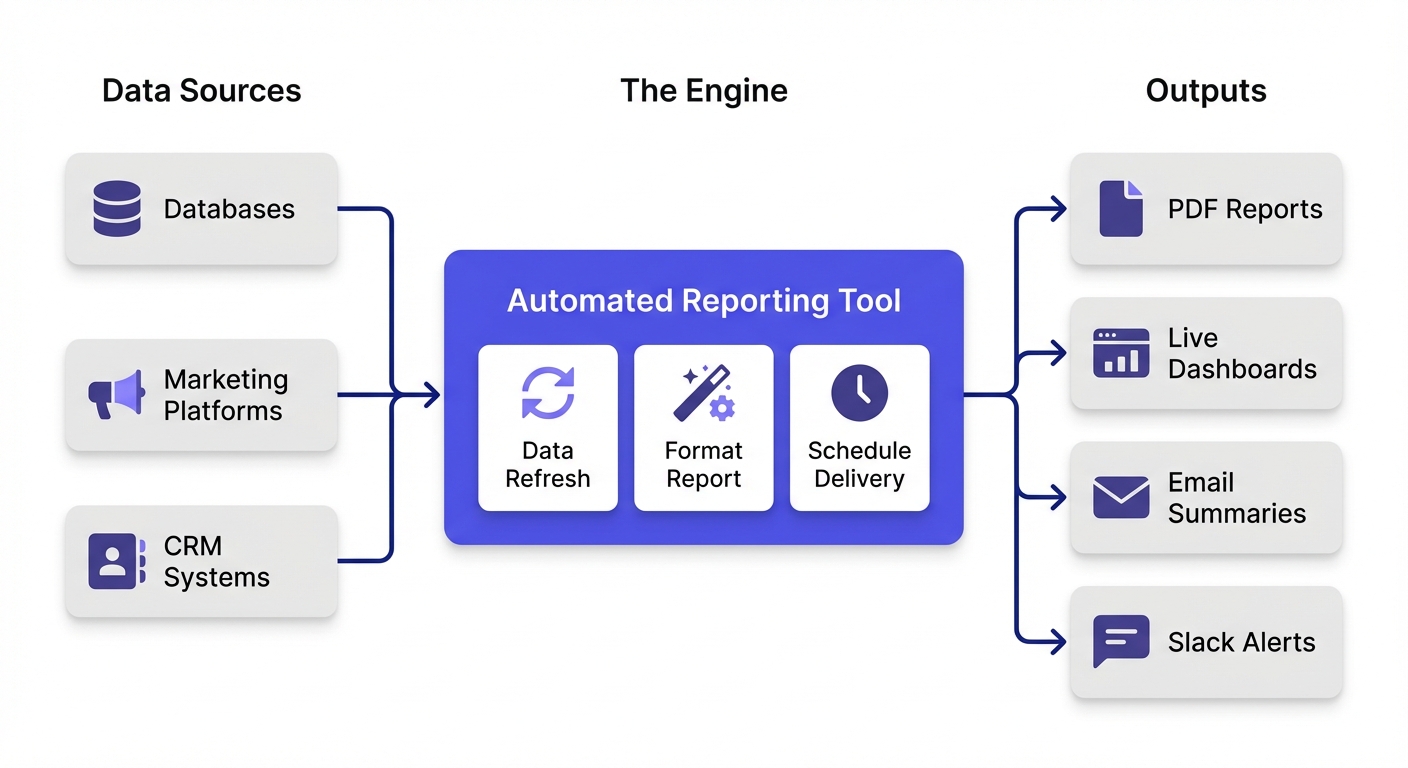
At its core, an automated reporting tool connects to your data, pulls metrics on a schedule, and pushes them out in a consumable format (a PDF, an embedded dashboard, or a Slack alert).
The automation loop typically handles:
- Data refreshes: Pulling fresh numbers daily, weekly, or hourly.
- Report generation: Formatting outputs without manual copy-pasting.
- Distribution: Pushing insights to email, Slack, or client portals.
- Alerting: Pinging you when a metric falls off a cliff.
But here is what the vendor landing pages leave out: scheduling is the easy part. The actual hard part is ensuring the underlying data is accurate, and getting people to actually read (and act on) the output.
The 4 Categories of Automated Reporting Tools
If you understand which of these four buckets you belong in, you will save weeks of evaluation time.
1. Marketing & Client Reporting Tools
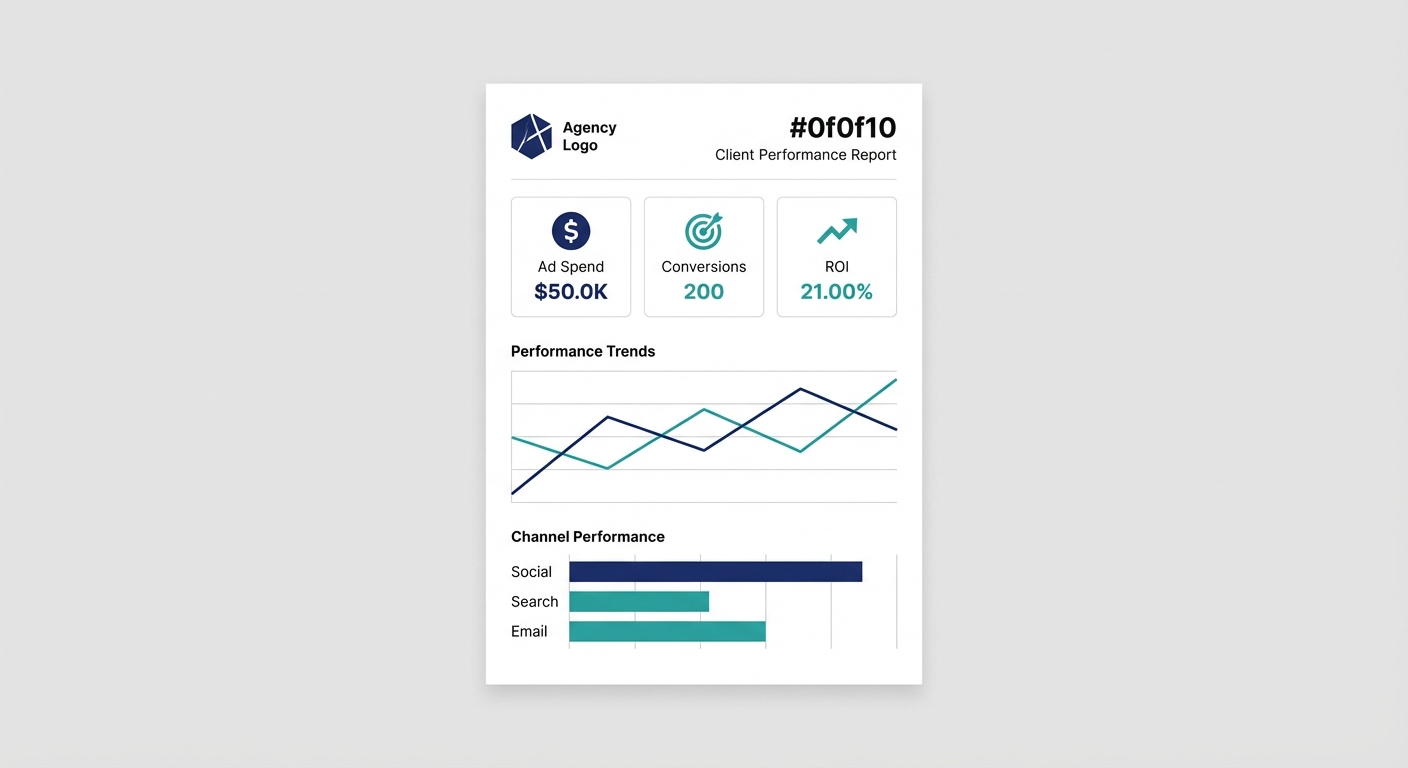
Best for: Agencies and marketing teams who need polished, white-labeled PDFs.
These tools pull directly from ad platforms (Meta, Google Ads, GA4) and spit out branded deliverables. They are built for recurring client updates, not deep ad-hoc data exploration.
- The good: 50-100+ native marketing connectors; massive template libraries.
- The catch: Very limited SQL access or custom data modeling.
2. AI-Native Analytics Platforms
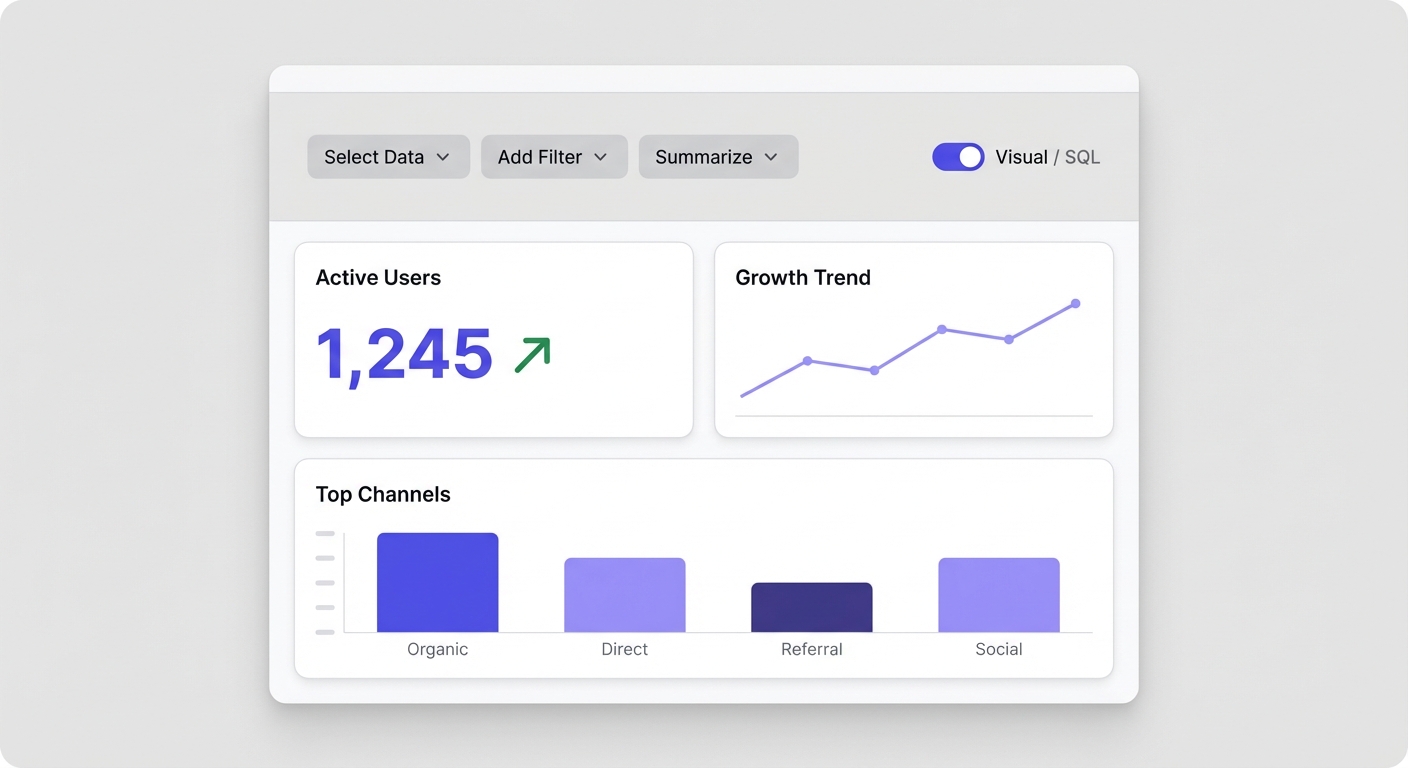
Best for: Teams who want true self-serve analytics and proactive insights.
These platforms are built around AI from day one. Instead of forcing users to interpret a static chart, they let anyone ask questions in plain English. The "automation" here actively tells you what changed and why.
- The good: Natural language querying; proactive AI insights; direct SQL warehouse connections.
- The catch: Less focused on pixel-perfect PDF formatting for external clients.
3. Traditional BI Platforms
Best for: Enterprises that need strict governance and complex data modeling.
The heavyweights (Tableau, Power BI, Looker). They excel at enterprise-scale deployments, semantic layers, and highly polished visualizations.
- The good: Unmatched governance; handles massive scale; complex modeling (DAX, LookML).
- The catch: Steep learning curves; expensive at scale; AI features are often clunky add-ons.
4. Open-Source & SMB Options
Best for: Technical teams wanting full control, or startups on a tight budget.
Tools like Metabase offer massive capability for zero licensing cost if you are willing to self-host.
- The good: Highly cost-effective; developer-friendly.
- The catch: You own the maintenance burden (if self-hosted); lighter on advanced enterprise features.
Quick Comparison: 14 Automated Reporting Tools
Here is the high-level landscape. (Pricing is based on current verified data).
| Tool | Category | Best For | Starting Price | Free Tier | AI Features |
|---|---|---|---|---|---|
| Whatagraph | Marketing | Agencies, marketing teams | ~$199/mo | Trial only | Basic (Whatagraph IQ) |
| AgencyAnalytics | Marketing | Full-service agencies | $49/mo | Trial only | Limited |
| DashThis | Marketing | Simple marketing reports | $49/mo | Trial only | None |
| Supermetrics | Marketing | Data connectors to sheets/BI | $29/mo | Trial only | None |
| BlazeSQL | AI-Native BI | Self-serve analytics, SQL teams | ~$400/mo | Free trial | Core (natural language, automated insights) |
| Domo | AI-Native BI | Enterprise analytics | Custom | Trial | Yes (AI Service Layer) |
| Zoho Analytics | AI-Native BI | SMBs in Zoho ecosystem | $24/mo | Yes (2 users) | Yes (Zia assistant) |
| Tableau | Traditional BI | Enterprise visualization | $42-75/user/mo | No | Limited (Pulse) |
| Power BI | Traditional BI | Microsoft shops | $10/user/mo | Desktop only | Yes (Copilot) |
| Looker | Traditional BI | Data-driven enterprises | Custom | No | Limited (Gemini) |
| Metabase | Open Source | Technical teams, startups | $85/mo (cloud) | Yes (self-hosted) | Limited |
| Klipfolio | SMB BI | SMB dashboards | $50/mo | Trial only | None |
| Databox | SMB BI | KPI tracking | $0-72/mo | Yes (3 sources) | Basic |
| Funnel.io | Data Platform | Marketing data aggregation | Custom | Trial | Limited |
---
Marketing & Client Reporting Tools
These are purpose-built for the agency use case. If your primary goal is making a campaign look good for an external client, start here.
Whatagraph
What it is: A cross-channel marketing reporter with automated delivery. Key features: 45+ marketing integrations, drag-and-drop templates, client-facing portals. Pricing: Professional tier starts around $199/month (5 users, 25 sources). The trade-off: You can't do complex SQL modeling. It is strictly for marketing data.
AgencyAnalytics
What it is: An all-in-one platform heavily tailored for full-service agencies, specifically strong in SEO. Key features: 80+ integrations (including rank tracking and site audits), custom formulas, white-label dashboards. Pricing: Freelancer is $49/month (5 campaigns); Agency is $149/month (15 campaigns). The trade-off: It gets pricey as your campaign volume scales. No native AI features.
DashThis
What it is: A highly simplified, template-driven marketing reporting tool. Key features: 34+ integrations, preset widgets, automated email delivery. Pricing: Starts around $49/month. The trade-off: Fewer integrations and zero advanced customization compared to its peers.
Supermetrics
What it is: A data connector (a pipeline, really) that pulls marketing metrics into your existing spreadsheets or data warehouses. Key features: 100+ connectors, native Google Sheets/BigQuery integration, scheduled data refreshes. Pricing: Essential $29/month (3 sources); Pro $399/month (45+ sources). The trade-off: It isn't actually a reporting tool. It is a data layer. You still have to build the report yourself.
---
AI-Native Analytics Platforms
This category flips the script. Instead of forcing you to build rigid dashboards, these tools let your team ask questions and get instant, accurate answers.
BlazeSQL
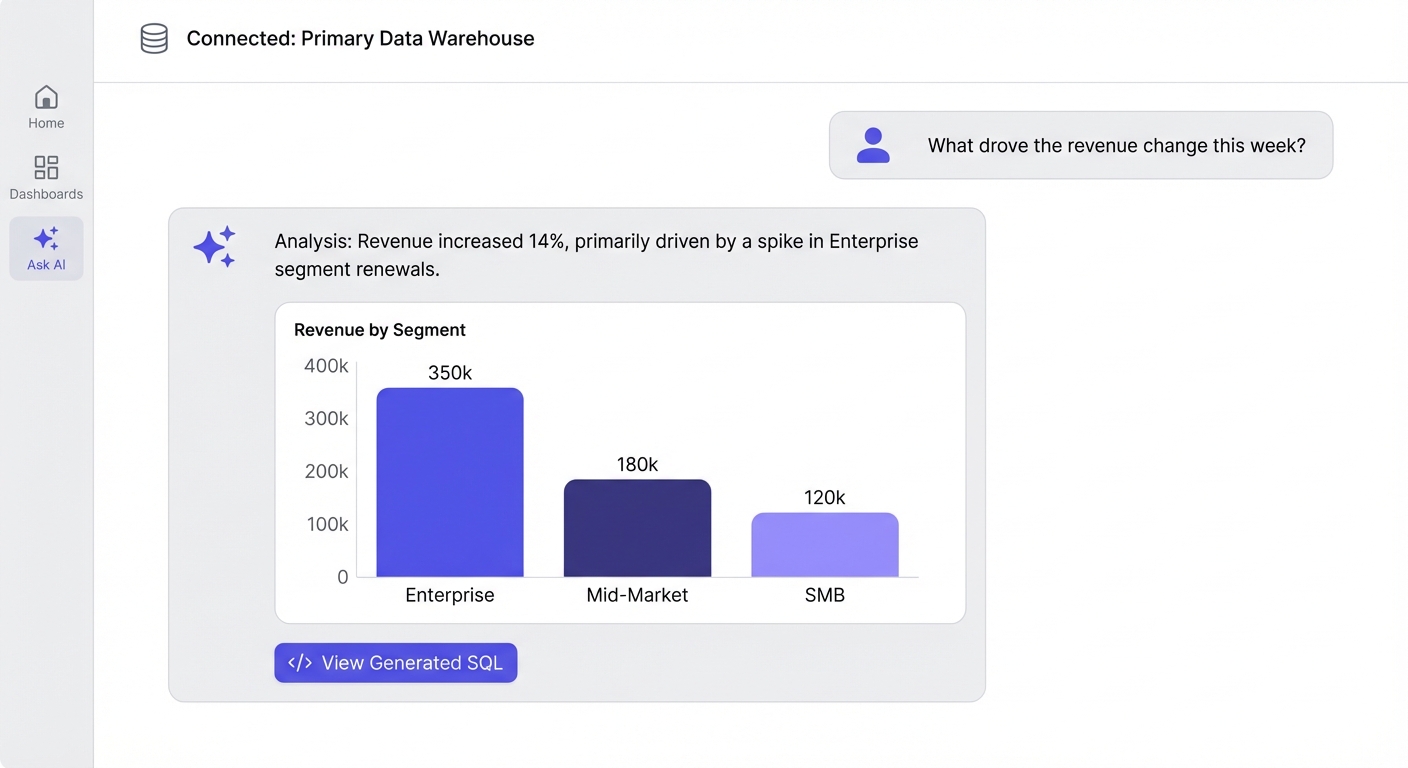
What it is: An AI-native analytics platform that connects directly to your SQL database. You ask questions in plain English, and it gives you automated insights on what changed and why. Key features:
- Natural language querying for Snowflake, BigQuery, Postgres, etc.
- AI-powered weekly email reports that summarize drivers of change, not just static numbers.
- A semantic knowledge base (you teach the AI your specific business logic).
- Strict governance (RBAC, table restrictions, desktop local-only options).
Pricing: Standard ~$400/month (3 users included, +$50/additional user); Advanced ~$800/month (3 users included, +$75/additional user). The trade-off: Optimized for internal team insights rather than pixel-perfect, white-labeled client PDFs. Why it's different: Most legacy BI tools bolt a chatbot onto their existing dashboard. BlazeSQL is built around AI from the core, meaning its automated reports actually do the analysis for you.
Domo
What it is: A massive enterprise BI platform with deep data integration and an "AI Service Layer." Key features: 1,000+ connectors, real-time embedded analytics, low-code app development. Pricing: Custom, consumption-based (enterprise contracts). The trade-off: Very complex and highly expensive. The AI features have mixed reliability reviews in the wild.
Zoho Analytics
What it is: Self-service BI that works particularly well if you already pay for the Zoho ecosystem. Key features: Zia (their AI assistant), drag-and-drop builder, scheduled alerts. Pricing: $24/month (2 users) up to $115/month (15 users). The trade-off: The AI is relatively basic. You get the best ROI if you already use Zoho CRM.
---
Traditional BI Platforms
The legacy giants. They offer unmatched control, but require serious technical overhead to maintain.
Tableau
What it is: The industry standard for complex data visualization. Key features: Unbeatable viz capabilities, Tableau Pulse (their AI feature), Prep Builder for data transformation. Pricing: Creator $75/user/month; Explorer $42/user/month; Viewer $15/user/month. The trade-off: It gets incredibly expensive at scale. The learning curve is a cliff, and their new AI (Pulse) is still unproven.
Power BI
What it is: Microsoft's ubiquitous BI platform. Key features: Deep Azure/Office integration, DAX modeling, Paginated reports. Pricing: Pro $10/user/month; Premium $20/user/month; Capacity starts at $4,995/month. The trade-off: It is notoriously complex. Even Microsoft admits their Copilot AI can produce "inaccurate or low-quality outputs."
Looker (Google Cloud)
What it is: An enterprise data platform famous for its semantic layer (LookML). Key features: Single source of truth via LookML, direct BigQuery integration, API-first embedding. Pricing: Custom (contact Google). The trade-off: You must know LookML to use it properly. Support quality has famously degraded since the Google acquisition.
---
Open-Source & SMB Options
If you have technical chops or a tight budget, don't sleep on these.
Metabase
What it is: A highly intuitive, open-source BI tool that non-technical people actually enjoy using. Key features: Visual query builder alongside a raw SQL editor, scheduled emails, self-hosted (free) or cloud options. Pricing: Free (self-hosted); Starter $85/month (cloud, 5 users). The trade-off: Self-hosting requires real DevOps work. Advanced enterprise features sit behind a steep paywall.
Klipfolio
What it is: Straightforward dashboarding and KPI tracking for small to mid-sized businesses. Key features: 100+ integrations, custom formula editor. Pricing: Starts at $50/month (4 users). The trade-off: Lacks AI features and deep, complex analytics capabilities.
Databox
What it is: A mobile-friendly KPI tracker focused on scorecards and goal monitoring. Key features: 70+ integrations, mobile app, basic AI anomaly detection. Pricing: Free (3 sources); Starter $72/month. The trade-off: Not designed for ad hoc querying or drilling down into granular data.
---
Pricing Comparison: What You'll Actually Pay
Vendor pricing pages are famously opaque. Here is a verified baseline for what you will actually spend:
| Tool | Entry Price | Mid-Tier | Enterprise |
|---|---|---|---|
| Whatagraph | ~$199/mo (5 users) | Custom | Custom |
| AgencyAnalytics | $49/mo (1 user) | $149/mo (unlimited users, 15 campaigns) | Custom |
| DashThis | ~$49/mo | Varies by dashboards | Custom |
| Supermetrics | $29/mo (3 sources) | $399/mo (45+ sources) | Custom |
| BlazeSQL | ~$400/mo (3 users, +$50/user) | ~$800/mo (3 users, +$75/user) | ~$3,000+/mo |
| Domo | Custom | Custom | Custom |
| Zoho Analytics | $24/mo (2 users) | $115/mo (15 users) | Custom |
| Tableau | $15/user/mo (Viewer) | $75/user/mo (Creator) | Custom |
| Power BI | $10/user/mo | $20/user/mo (Premium) | $4,995/mo (Capacity) |
| Looker | Custom | Custom | Custom |
| Metabase | Free (self-hosted) | $85-500/mo (cloud) | Custom |
| Klipfolio | $50/mo (4 users) | $200/mo (16 users) | Custom |
| Databox | Free (3 sources) | $135/mo | Custom |
🚨 Watch out for these hidden costs:
- The per-user trap: Tableau looks cheap at $15/user, but scales brutally as you roll it out to 100 people.
- Data volume penalties: Some vendors charge by row count or data processed.
- Premium connectors: "100+ integrations" often means the ones you actually want cost extra.
Build vs. Buy: When DIY Makes Sense (And When It Doesn't)
Every technical team considers rolling their own automated reporting at least once. Usually, it's a trap.
When to build:
- Your use case is incredibly narrow and won't evolve.
- You have dedicated engineering headcount to maintain it forever.
When to buy (almost always):
- Stakeholders have varying levels of technical skill.
- You know the requirements will change.
Here is a classic Reddit success story: an analyst writes a Python script, saves 5 hours a week, and saves the company $20k a year in productivity.
It's a massive win. But what that post ignores is the aftermath. The script breaks when an API updates, the analyst leaves the company, and suddenly that "free" automation is a black box nobody knows how to fix.
The true TCO breakdown:
| Factor | Build | Buy |
|---|---|---|
| Time-to-value | Months | Days/weeks |
| Maintenance burden | Internal team forever | Vendor handles it |
| Scaling to new use cases | Rebuild each time | Usually included |
| Governance/audit | You build it | Built-in |
| Risk of abandonment | High (key person leaves) | Low |
For 95% of product and growth teams, your engineering time is better spent building your core product, not reinventing a BI tool.
Why AI Claims in Reporting Tools Often Don't Hold Up
Every vendor slaps an AI label on their homepage now. The reality? Most of them fall apart when they hit real, messy data.
The pattern we consistently see:
- Demos look like magic; reality looks like a syntax error.
- "Insights" turn out to be basic anomaly detection with a shiny UI.
- The AI can't answer complex follow-ups.
Take Power BI Copilot. It's the most high-profile AI integration on the market, yet Microsoft's own documentation warns it can generate "incorrect answers to data questions." Reddit users regularly call the outputs "embarrassing."
Why bolted-on AI fails:
- It lacks your unique business context (it doesn't know how you define a "churned user").
- The underlying architecture wasn't built for conversational logic.
- There is no loop for the AI to learn from its mistakes.
What to look for instead: Choose tools built around AI natively. Make sure they let you teach the AI your specific business logic, and always ensure the tool shows its work (e.g., exposing the raw SQL it generated so you can verify it).
Still unsure which type of automated reporting fits your needs? Take our assessment for personalized recommendations.
What Actually Makes Automated Reporting Fail
The scheduled PDF sending every Monday morning isn't the point of failure. Reporting fails because of the human layer.
1. Nobody actually reads it
If you send the exact same table every week, the burden is on the reader to spot the delta, analyze the trend, and form a hypothesis. Most people won't do that cognitive work. The fix: Use AI-powered reporting that highlights what changed and why, doing the analysis layer for them.
2. The numbers are technically right, but business-wrong
Your report pulls "monthly revenue," but forgets to exclude test transactions and refunds because that logic only lived in one analyst's head. The fix: Centralize your logic. Whether it's a semantic layer (Looker) or an AI knowledge base (BlazeSQL), define your terms explicitly in the tool.
3. It answers the wrong question
A dashboard shows conversions dropped 15%. Great. But the stakeholder actually needs to know why they dropped. Now they have to go Slack an analyst anyway. The fix: Ensure your automated reporting is paired with ad hoc, self-serve capabilities so users can immediately drill down into the anomalies.
4. It's unactionable
Knowing churn is up is useless if customer success doesn't know which accounts are at risk. The fix: Connect your reporting directly to operational workflows, alerting specific teams to specific data cuts.
How to Choose: A Decision Framework
Don't evaluate all 14 tools. Pick your category first.
Go with Marketing/Client tools (Whatagraph, AgencyAnalytics) if:
- You are an agency reporting to external clients.
- White-labeling and PDF exports are non-negotiable.
- You don't need SQL access.
Go with AI-Native platforms (BlazeSQL) if:
- You want your non-technical team to self-serve answers.
- You want automated reports that explain the "why" behind the data.
- Your data lives in a SQL warehouse.
- You value speed-to-insight over pixel-perfect board decks.
Go with Traditional BI (Tableau, Power BI, Looker) if:
- You require strict enterprise governance.
- You have a dedicated data engineering team to maintain it.
- You are deeply entrenched in the Microsoft or Google Cloud ecosystem.
Go with Open-Source (Metabase) if:
- You have strong technical chops but a low budget.
- You just need reliable, straightforward dashboards.
The Bottom Line
The automated reporting space is incredibly noisy, but the actual solutions are highly segmented.
For agencies, Whatagraph or AgencyAnalytics will save you massive headaches over trying to force a BI tool into a marketing deliverable.
If you want true self-serve analytics, the traditional "build a dashboard and pray" model is dead. Look closely at AI-native tools like BlazeSQL that actually let your team ask questions and get insights automatically.
If you are an enterprise that needs absolute governance, Tableau and Power BI are still the heavyweights—just don't buy them expecting their AI to work miracles out of the box.
And if you're a technical team on a strict budget, Metabase is a phenomenal piece of software.
Start with your team's technical depth and your primary consumer. Let the use case dictate the tool.
Without context, Power BI Copilot may lead you to misinterpret data.
View on Reddit