


18 Best BI Reporting Tools in 2026: A No-BS Comparison

Most "best BI tools" articles are recycled marketing fluff. They list 15 platforms, praise everyone's "powerful analytics," and leave you exactly where you started.
We did the actual work.
We dug through Reddit, verified pricing (where vendors don't hide it), and separated real AI utility from sales demos. Because the goal isn't finding the tool with the most features. It's finding the one that actually stops the ad-hoc data requests from piling up in Slack.
The market is huge—$47 billion in 2025 according to Precedence Research—but bigger isn't always better for your stack.
Here is the candid, evidence-backed breakdown.
Not sure which solution is right for your needs? Take our quick 2-minute assessment to get personalized recommendations.
TL;DR: Quick Recommendations
Best for Microsoft shops on a budget: Power BI ($10-20/user/month)
Best for executive-quality visualizations: Tableau ($70/user/month)
Best for killing ad-hoc request bottlenecks: BlazeSQL (AI-native, seat-based pricing)
Best for spreadsheet-native finance teams: Sigma Computing (quote-based)
Best for dbt-centric data teams: Lightdash or Holistics
Best for pixel-perfect operational reports: Power BI Paginated Reports or SSRS
Best for budget-conscious startups: Metabase (open-source)
---
What Are BI Reporting Tools, Really?
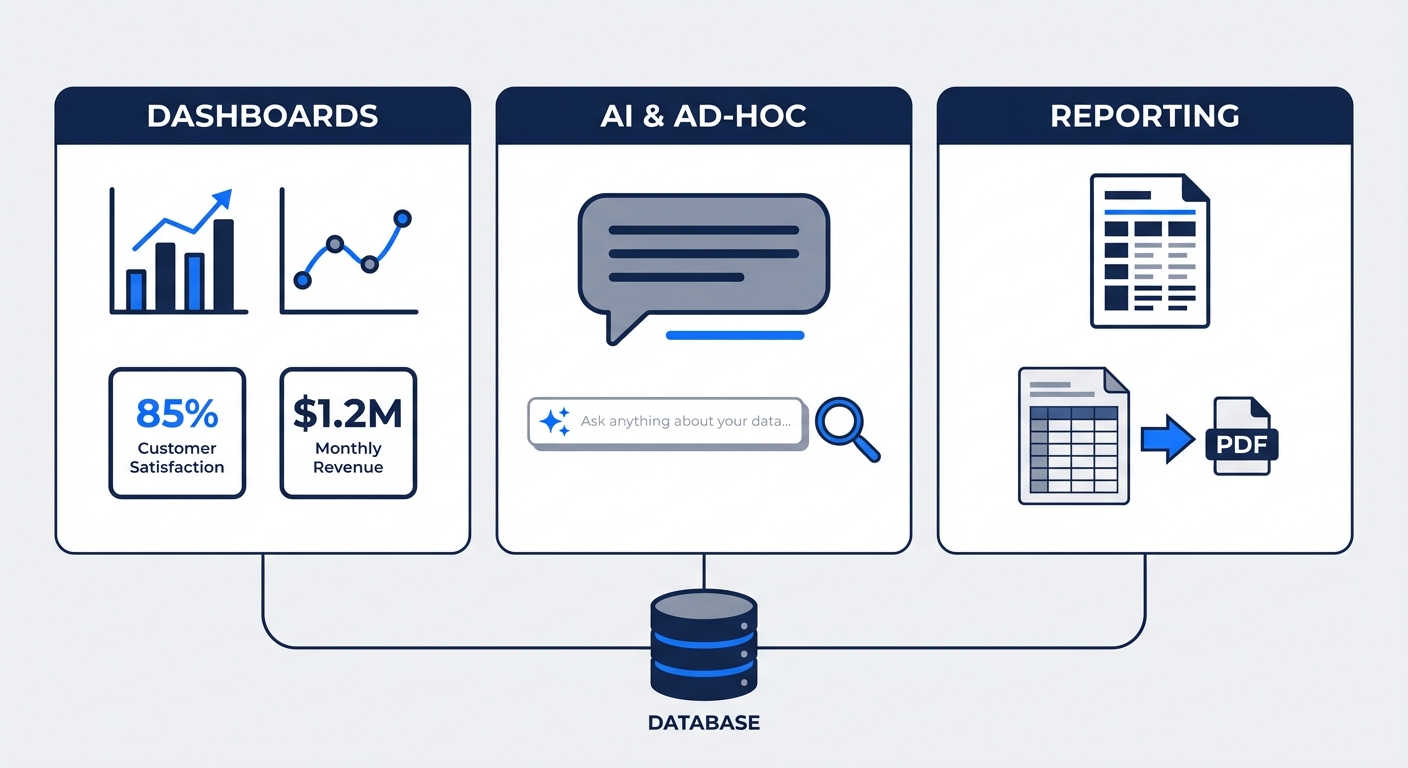
Let's clarify the terminology. "BI reporting" is a messy category covering three distinct needs. You usually only need to solve one of them at a time:
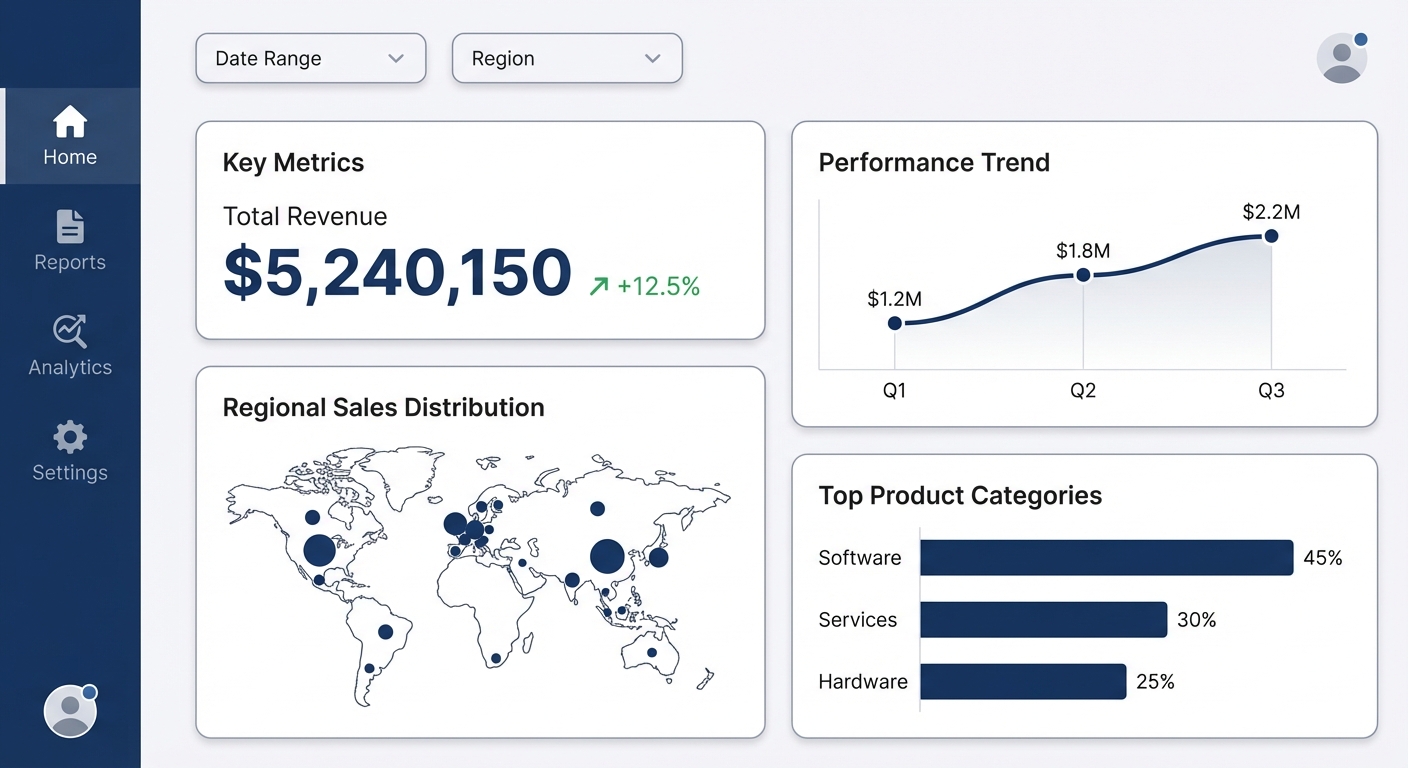
1. Interactive Dashboards: Visuals you filter and drill down into. This is the standard "BI" dashboard.
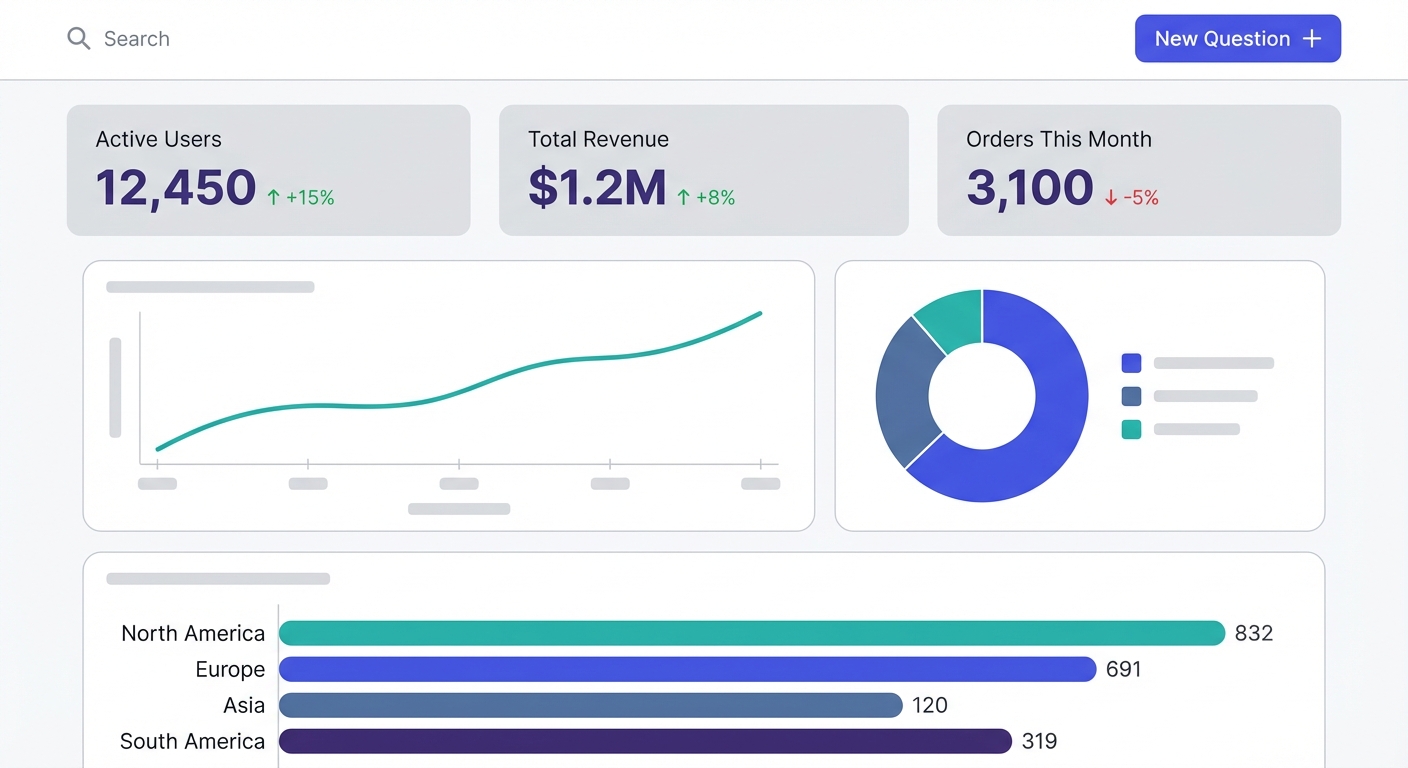
2. Ad-Hoc Analysis & Q&A: The one-off Slack questions: "What was retention by channel last month?" This is where your team's time actually goes.
3. Paginated/Operational Reports: Boring, essential, pixel-perfect PDFs (invoices, reg filings). You know if you need these.
Most tools specialize in one. Don't expect a dashboard tool to be good at ad-hoc exploration.
---
How to Evaluate BI Reporting Tools
Forget the feature matrix. Here is what actually matters when buying:
1. Who Will Use It?
If it's for business users, ignore "powerful customization" and look for usability. If they can't figure it out, they'll just email you anyway.
2. Your Data Stack
Does it read your warehouse directly? Play nice with dbt? If it requires a massive migration or proprietary data prep, the friction usually isn't worth it.
3. True Cost of Ownership
Licensing is the cheap part. The real cost is implementation time, training, and the salary of the person maintaining the dashboards.
4. Governance Needs
Startups can skip this; enterprises cannot. If you need Row-Level Security (RLS), SSO, and audit logs, check those boxes first.
5. AI Features: Real or Demo-ware?
Everyone claims AI now. Most of it is a chat interface bolted onto a legacy architecture. Be skeptical.
---
The 18 Best BI Reporting Tools for 2026
We've categorized these by their actual strengths, not just market cap.
Enterprise Dashboard Platforms
The heavy hitters. Mature, governed, and the default for large orgs.
Microsoft Power BI
Pricing: $10/user/month (Pro), $20/user/month (Premium Per User)
Best for: Microsoft shops, budget constraints, governed self-service.
Power BI is the market leader because it works and it's cheap. It integrates deeply with Office 365 and has led the Gartner Magic Quadrant for 18 years.
The Good:
- Price: 7x cheaper than Tableau (Pro level).
- Ecosystem: Deep integration with Excel and Azure.
- Talent: It's easy to find hires who know Power BI.
The Bad:
DAX (the formula language) is brutal. Expect a 5-6 month learning curve for proficiency. Also, the desktop-vs-service experience is disjointed.
Verdict: The safe, high-value choice. Just budget for training your team on DAX.
---
Tableau
Pricing: $70/user/month (Creator), $42 (Explorer), $15 (Viewer)
Best for: Executives who care about aesthetics, pure visualization.
Tableau is still the gold standard for "pretty." If you need presentation-quality charts, this is it.
The Good:
- Visuals: Best-in-class, period.
- Community: Huge user base and learning resources.
- Prep: Visual data prep tools are solid.
The Bad:
Since the Salesforce acquisition, pricing has become aggressive. Users report costs doubling. Cloud performance can also be sluggish.
Verdict: Great tool, scary pricing. Get a multi-year contract in writing.
---
Looker (Google Cloud)
Pricing: Quote-based (typically between Power BI and Tableau)
Best for: GCP shops, data teams who want code-based governance.
Looker pioneered the semantic layer (LookML). It defines metrics in code so everyone sees the same numbers.
The Good:
- LookML: Centralized metric definitions prevent "why do our numbers not match?" arguments.
- Git Integration: Version control for your data models.
- BigQuery: Works seamlessly if you're on Google Cloud.
The Bad: Sentiment is mixed. One Redditor nailed it: "Tableau has better visuals, Power BI has a better semantic layer. Looker is... not as good at either." The learning curve is steep.
Verdict: Strong for GCP teams with engineering resources. Hard pass if you aren't on Google Cloud.
---
Qlik Sense
Pricing: Quote-based
Best for: Associative data exploration in enterprise.
Qlik uses an "associative engine" that reveals data relationships traditional SQL queries miss.
The Good:
- Exploration: Great for finding connections you didn't ask for.
- Governance: Enterprise-grade security.
- Scripting: Powerful data manipulation.
The Bad: Mindshare is shrinking. It's harder to find Qlik developers than Power BI experts. The "associative" mental model is also a shift from SQL logic.
Verdict: Powerful, but niche. High adoption cost (mental and financial).
---
Domo
Pricing: Consumption-based (median ~$46K/year)
Best for: Executive dashboards, speed-to-value.
Domo is an all-in-one platform (ETL + Store + Visualize). Executives love it; data engineers often tolerate it.
The Good:
- Connectors: 1,000+ pre-built integrations.
- Speed: fast to set up executive dashboards.
- Unified: One tool does it all.
The Bad: Consumption pricing is unpredictable. You can accidentally blow your budget if adoption spikes.
Verdict: Good for consolidated tooling, but model your consumption costs carefully.
---
Amazon QuickSight
Pricing: $9-18/user/month, or pay-per-session
Best for: AWS shops, occasional viewing.
QuickSight's "pay-per-session" model is a killer feature for orgs with 500 people who view a dashboard once a month.
The Good:
- Serverless: No infrastructure to manage.
- Cost: Session pricing saves a fortune for low-usage viewers.
- Speed: SPICE engine is fast.
The Bad: Customization is limited compared to Tableau/Power BI. The UI can be clunky.
Verdict: The practical choice for AWS heavy users.
---
AI-Native BI Platforms
These aren't legacy tools with a chatbot added. They were built around AI to solve the context and reliability problems of natural language analytics.
BlazeSQL
Pricing: Seat-based, starts ~$400/month (3 users)
Best for: Killing the ad-hoc request backlog.
BlazeSQL doesn't build dashboards for people to stare at. It lets people ask questions and get answers (SQL + Visuals).
The Hook:
- AI-Native: Built to handle ambiguity, not just strict keywords.
- Knowledge Base: You teach it business context ("Revenue means X, not Y") without complex modeling.
- Workflow: Includes query reviews and training modes to improve accuracy over time.
The Reality: Users report saving 1-1.5 days a week on ad-hoc tickets. One customer skipped hiring a BI analyst because the self-service actually worked.
The Trade-off: You need someone who knows SQL to set it up and monitor quality. It's not for pixel-perfect printing.
Verdict: The specific fix for "Slack request overload."
---
ThoughtSpot
Pricing: Quote-based (Enterprise), starts ~$50/user/mo for small teams
Best for: Large enterprises wanting search-driven analytics.
ThoughtSpot is "Google for your data." They pioneered search-based BI and have impressive case studies (779% ROI).
The Good:
- Search Interface: Genuine natural language querying.
- SpotIQ: Automated insight discovery.
- Speed: Fast analysis on massive datasets.
The Bad: Expensive. It requires a behavior change from users (searching vs. clicking).
Verdict: High ROI potential for big enterprises, but comes with a big price tag.
---
Modern Data Stack BI Tools
Built for the dbt/Snowflake era. Code-friendly, git-integrated, and loved by data engineers.
Sigma Computing
Pricing: Quote-based
Best for: Finance teams, Excel power users.
Sigma's insight: Spreadsheets aren't the enemy. It gives you a spreadsheet interface that queries the warehouse directly (live data, no stale exports).
The Good:
Finance teams love it. It feels like Excel but scales like Snowflake.
The Bad: Requires a cloud warehouse. It's less "BI Tool," more "Super Excel."
Verdict: If your finance team lives in CSV exports, get this.
---
Hex
Pricing: Free (Community), $36-75/editor/month
Best for: Data scientists, exploratory analysis.
Hex merges SQL notebooks with UI building. It's Jupyter Notebooks made accessible.
The Good:
- Flexibility: Switch between SQL, Python, and no-code.
- Exploration: Fantastic for deep dives.
- Magic: Good AI code generation assistant.
The Bad: Too technical for average business users.
Verdict: The best tool for data science teams who need to share work.
---
Holistics
Pricing: Starts $800/month (10 users)
Best for: Teams who want Looker governance without Looker complexity.
"Dashboard as code." You define logic in code, ensuring version control and consistency.
The Good:
- Governance: Strong semantic layer.
- Git Integration: Fits engineering workflows.
- Innovation: Often moves faster than legacy players.
The Bad: Requires technical skills to maintain. Smaller community.
Verdict: A great modern alternative to Looker.
---
Omni
Pricing: Quote-based (approx. $30K platform fee)
Best for: Modern data stack teams, Looker migrants.
Created by former Looker execs, Omni tries to fix what Looker got wrong. It uses a YAML-based semantic layer and integrates tightly with dbt.
The Good:
- Architecture: Smart caching (DuckDB) and solid semantic layer.
- Support: Early adopters rave about the team.
The Bad: It's new. Features are still catching up to the giants.
Verdict: The one to watch if you want a modern Looker.
---
Lightdash
Pricing: $800-2,400/month (Cloud), Free (Self-hosted)
Best for: dbt die-hards.
Lightdash is BI for dbt. It reads your dbt project to generate metrics. No separate semantic layer to maintain.
The Good:
- DRY: Define metrics once in dbt, use everywhere.
- Workflow: Matches how data engineers already work.
- Open Source: You can host it yourself.
The Bad: If you don't use dbt, this is useless. Feature set is lighter than Tableau/Power BI.
Verdict: If you use dbt, evaluate this immediately.
---
Mode
Pricing: Free (Studio), Quote-based (Pro)
Best for: SQL-first analysts.
Mode is SQL notebooks + Visuals. Perfect for analysts who think in queries.
The Good:
- Workflow: Seamless SQL and Python integration.
- Speed: Fast from query to chart.
The Bad: Governance is weaker. Row-level security often requires workarounds.
Verdict: Great for analysts, less so for governed enterprise reporting.
---
Paginated Reporting Specialists
For when you need a perfectly formatted PDF invoice or regulatory filing. Do not use these for exploration.
Power BI Paginated Reports (Report Builder)
Pricing: Included with Power BI Premium
Best for: Pixel-perfect reports in Microsoft shops.
This is modern SSRS.
The Good:
- Integration: Lives alongside your Power BI dashboards.
- Power: Can format anything, anywhere.
The Bad: Requires Premium. The Report Builder tool is separate and requires a different skillset than standard Power BI.
Verdict: The default for Microsoft operational reporting.
---
SQL Server Reporting Services (SSRS)
Pricing: Included with SQL Server
Best for: On-prem legacy setups.
The dinosaur that still runs half the world's banking reports.
The Good:
- Free: If you have SQL Server.
- Proven: It works.
The Bad: It's dated. Microsoft prefers you move to the cloud.
Verdict: Stick with it if you're stuck on-prem.
---
Jaspersoft
Pricing: Quote-based (Community edition available)
Best for: Java developers, embedded reporting.
The Good:
- Embedding: Great for putting reports inside your own apps.
- Flexible: Open-source options.
The Bad: UI is dated. Support varies.
Verdict: Good for Java-heavy dev teams needing embedded reports.
---
Open-Source BI Tools
Free software, if your time is worth $0.
Apache Superset
Pricing: Free (Self-hosted), Preset.io for managed
Best for: Engineering teams, customization.
Born at Airbnb. Highly customizable, powerful, and free.
The Good:
- Flexible: Extend it however you want.
- Embeddable: Great for putting analytics in your product.
The Bad: Self-hosting is a chore. Visual consistency used to be rough (it's getting better).
Verdict: Great for engineers with DevOps capacity.
---
Metabase
Pricing: Free (Self-hosted), Metabase Cloud available
Best for: Startups, simplicity.
The easiest way to give a startup data access.
The Good:
- Simple: Non-technical people can actually use it.
- Setup: Takes 5 minutes (Docker).
The Bad: Limited features. Hits a wall with complex enterprise needs.
Verdict: The default choice for early-stage startups.
---
BI Reporting Tools Comparison Matrix
| Tool | Starting Price | Best For | Learning Curve | Self-Service | Dashboards | Paginated Reports |
|---|---|---|---|---|---|---|
| Power BI | $10/user/mo | Microsoft shops | Medium (DAX) | Medium | ✅ Strong | ✅ With Report Builder |
| Tableau | $70/user/mo | Visualization | Low-Medium | Medium | ✅ Excellent | ❌ Limited |
| Looker | Quote-based | GCP/governance | High (LookML) | Medium | ✅ Good | ❌ Limited |
| Qlik Sense | Quote-based | Associative exploration | Medium-High | Medium | ✅ Strong | ✅ Good |
| Domo | ~$46K/year | Executive dashboards | Medium | Medium | ✅ Good | ❌ Limited |
| QuickSight | $9/user/mo | AWS environments | Medium | Medium | ✅ Good | ✅ Available |
| BlazeSQL | $400/mo (3 users) | Ad-hoc self-service | Low | ✅ High | ✅ Via NL | ❌ Basic |
| ThoughtSpot | Quote-based | Search-driven analytics | Medium | High | ✅ Good | ✅ Available |
| Sigma | Quote-based | Finance/spreadsheet users | Low | High | ✅ Good | ✅ PDF export |
| Hex | $36/editor/mo | Data science exploration | Medium-High | Low | ✅ Apps | ❌ No |
| Holistics | $800/mo | Code-based governance | Medium-High | Medium | ✅ Good | ❌ Limited |
| Omni | Quote-based | Modern data stack | Medium | Medium | ✅ Good | ❌ Limited |
| Lightdash | $800/mo | dbt-native teams | Medium | Medium | ✅ Good | ❌ No |
| Mode | Free tier | SQL-first analysts | Medium | Low | ✅ Good | ❌ No |
| Power BI Paginated | With Premium | Operational reports | Medium | Low | ❌ No | ✅ Excellent |
| SSRS | With SQL Server | On-prem reporting | Medium | Low | ❌ No | ✅ Excellent |
| Jaspersoft | Free/Quote | Embedded reporting | High | Low | ✅ Basic | ✅ Excellent |
| Superset | Free | Embedded/custom | Medium-High | Medium | ✅ Good | ❌ Limited |
| Metabase | Free | Simple analytics | Low | Medium | ✅ Basic | ❌ No |
---
The AI Reality Check: What Actually Works?
This is where marketing separates from reality. Every vendor says they have "AI." Most don't deliver.
The Uncomfortable Truth
That quote is from January 2026. The consensus?
What fails:
- Dashboard Generation: "We could not get it to create anything useful."
- Business Logic: AI has no idea what "churn" means to your specific company unless explicitly taught.
- Comparisons: "Couldn't handle anything beyond surface-level analysis."
What works:
- Simple lookups on clean data.
- Text summarization.
- Writing basic SQL/DAX formulas for you.
Why "Bolt-On" AI Fails
You can't just slap a chat bot on a 15-year-old tool and expect magic. The AI lacks context. It's like asking a GP to perform heart surgery—they have the hands, but not the training.
What Makes AI Actually Work
Successful AI implementations share three traits:
- Native Design: AI is the core interface, not a sidebar.
- Ops Infrastructure: You can easily "teach" the tool business context and fix its mistakes.
- Realistic Scope: It augments humans; it doesn't replace them.
Don't trust demos. Ask for a customer reference who has been using the AI features in production for 6 months.
Not sure which solution is right for your needs? Take our quick 2-minute assessment to get personalized recommendations.
---
Implementation Considerations
Buying the tool is the easy part. Here is how to actually get value:
1. Fix the Bottleneck, Not the Features
If your problem is ad-hoc requests, 50 new chart types won't help you. If you need regulatory PDFs, a cool AI chat won't help you. Buy for the bottleneck.
2. Slow Rollout
Do not launch to the whole company at once. You will fail. Pick one team, learn their data quirks, fix the gaps, then expand.
3. Own the Definitions
Implementations fail because nobody agrees on what "Active User" means. If you don't define metrics, your BI tool just becomes a new place to argue about math.
4. Respect the Excel Workflow
People love Excel. Don't fight it. Pick tools that export cleanly to CSV so users can do their last-mile analysis where they are comfortable.
5. Budget for Adoption
A $10 tool used by everyone beats a $70 tool used by no one. Spend money on training and documentation, not just licenses.
---
Frequently Asked Questions
What's the difference between BI reporting and analytics?
Reporting is structured and repeatable (dashboards, KPIs). Analytics is exploratory and messy (why did this happen?). Most "BI tools" are great at reporting but mediocre at deep analytics.
Can AI replace my BI team?
No. AI kills the backlog of boring requests ("pull this number"), but you still need humans to manage governance, definitions, and data quality. The role shifts from "ticket taker" to "data product owner."
Power BI or Tableau?
- Power BI if you use Microsoft and care about budget.
- Tableau if visuals are everything and you have money to burn.
For many, neither is the answer to the ad-hoc analysis problem.
What about embedded analytics?
If you are building a SaaS product, look at Sisense, Superset, or GoodData. General BI tools are usually clunky when embedded.
Is open-source BI production-ready?
Yes, but it's not "free." You pay in DevOps time. Superset and Metabase are solid, but if you don't have engineering capacity, pay for the hosted versions.
---
Why AI-Native BI Is Worth Evaluating
Let's zoom in on the ad-hoc request problem.
Traditional tools (Power BI, Tableau) are great for answering questions you know people will ask (dashboards). They are terrible at answering the questions you didn't predict.
Those unpredicted questions become Slack messages. Those messages become Jira tickets. Those tickets bury your data team.
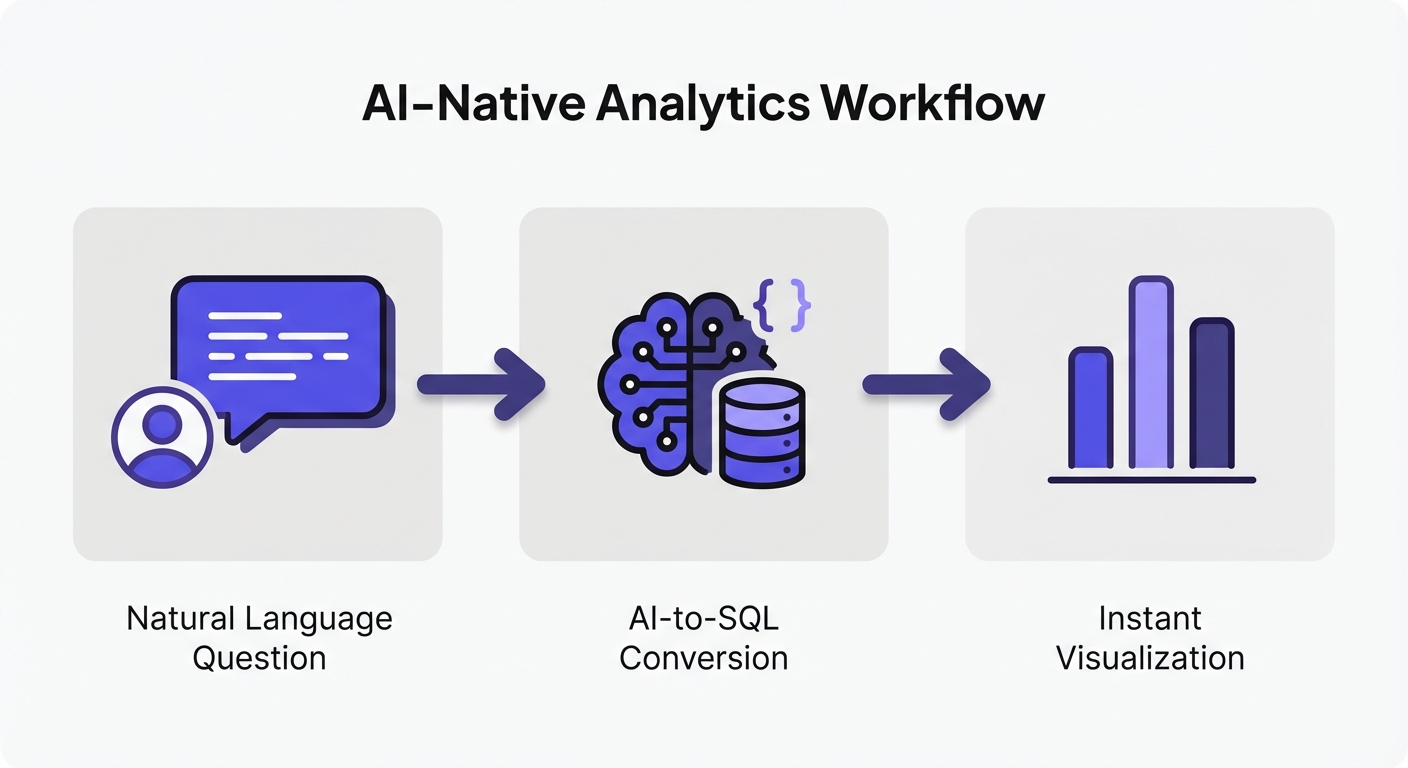
AI-native tools (like BlazeSQL) flip the model. You don't pre-build every answer. You build a system that can answer questions on demand.
The reliability comes from operationalizing the AI:
- Teaching it business context (schema mapping).
- Reviewing user queries (QA).
- Locking in correct answers (caching).
Teams using this approach save 1-2 days a week. It turns the data team from a bottleneck into an enabler. If your team is drowning in tickets, this is the category to watch.
See how AI-native BI eliminates ad-hoc request bottlenecks.
---
Final Thoughts
There is no "best" tool. There is only the tool that fits your constraints.
- Microsoft shop on a budget? Power BI.
- Visuals over everything? Tableau.
- GCP & Engineering heavy? Looker.
- Drowning in ad-hoc requests? BlazeSQL.
- Finance team loves Excel? Sigma.
- Living in dbt? Lightdash.
- Bootstrapped? Metabase.
Start with your bottleneck. Involve the users. Be honest about your technical bandwidth. The best tool is the one your team actually uses.
Personally, my overall pick for strongest BI platform is Sigma. Omni is a close runner up.
View on Reddit