


BI Tool Comparison 2026: 18 Tools Compared (Features, Pricing & Real User Feedback)

Choosing a BI tool is harder than it needs to be. Every vendor website claims their tool is "AI-powered" and "self-service," yet the data shows 73% of BI implementations fail to deliver ROI in year one.
The problem isn't a lack of options. It's cutting through the marketing fluff to find what actually works.
We analyzed 18 distinct tools using real user evidence from Reddit, G2, and Capterra, validated pricing data, and an honest look at which AI features are useful versus which are just marketing theater. We’ve categorized them based on how teams actually use them—not how they sell themselves.
TL;DR: There is no "perfect" tool.
- Need standard reporting? Stick to traditional enterprise tools.
- Need ad-hoc answers? You need an AI-native or search-based layer.
- The reality: Most successful enterprises use a hybrid approach—a traditional tool for the C-suite dashboard and a flexible tool for the day-to-day questions.
Not sure which solution is right for your needs? Take our quick 2-minute assessment to get personalized recommendations.
Quick Comparison Table
| Tool | Best For | Starting Price | G2 Rating | AI Features |
|---|---|---|---|---|
| Power BI | Microsoft shops | $14/user/mo | 4.6/5 | Copilot (beta) |
| Tableau | Data visualization | $15/user/mo | 4.6/5 | Pulse (beta) |
| Qlik Sense | Associative exploration | $200/mo flat | 4.5/5 | Insight Advisor |
| Oracle Analytics | Oracle ecosystem | $16/user/mo | 4.4/5 | Built-in ML |
| SAP Analytics Cloud | SAP shops | $36/user/mo | 4.3/5 | Joule AI |
| IBM Cognos | Enterprise reporting | $11/user/mo | 4.3/5 | AI Assistant |
| BlazeSQL | Ad hoc self-service | $400/mo (3 users) | 4.5/5 | AI-native |
| ThoughtSpot | Search-based analytics | $25/user/mo | 4.4/5 | Spotter AI |
| Sigma Computing | Excel users | ~$300/mo | 4.3/5 | Ask Sigma |
| Looker | Semantic modeling | ~$5K/mo min | 4.4/5 | Gemini integration |
| Domo | All-in-one platform | ~$50K/year | 4.3/5 | AI Chat |
| Amazon QuickSight | AWS users | $3/user/mo | 4.3/5 | Q (beta) |
| Holistics | dbt integration | $800/mo flat | 4.4/5 | AI-assisted |
| Sisense | Embedded analytics | ~$21K/year | 4.3/5 | GenAI features |
| GoodData | Headless BI | Contact sales | 4.2/5 | Limited |
| Metabase | Small teams | Free (self-host) | 4.4/5 | Metabot (paid) |
| Apache Superset | Technical teams | Free | 4.5/5 | Via integrations |
| Redash | SQL-first teams | Free | 4.3/5 | None |
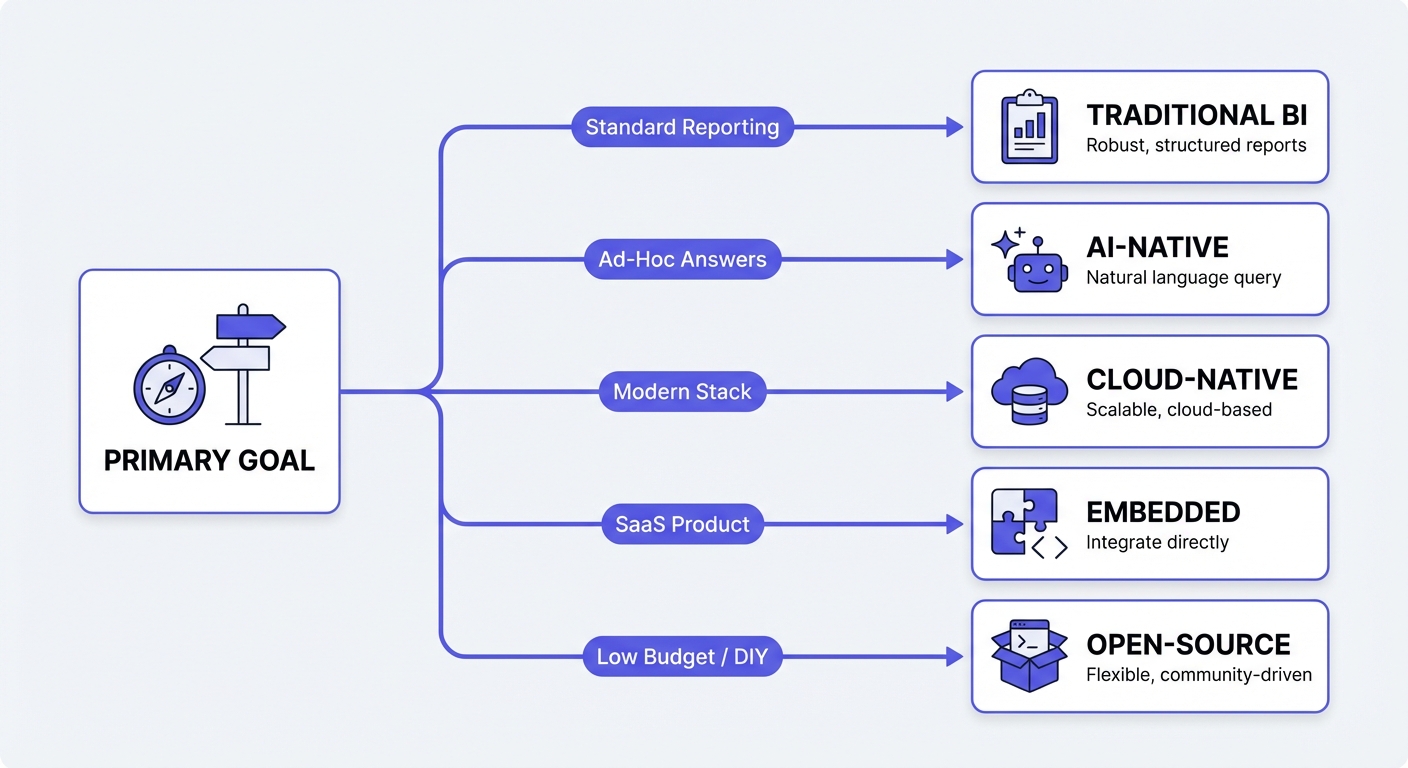
How to Actually Choose a BI Tool
Forget the "feature list" comparison. Every tool has charts. Based on conversations with hundreds of teams, here are the four questions that actually determine success:
1. Who needs insights (and can they code)? If your users know SQL, traditional tools are great. If you need marketing, ops, or sales to answer their own questions without pestering the data team, traditional BI will fail them. You need a self-service focus.
2. Is it reporting or ad hoc? Does your team need the same 5 dashboards refreshed every Monday? Or do they have 50 new, random questions every week? The former is "Reporting" (Traditional BI). The latter is "Analysis" (AI/Search-based).
3. What is your ecosystem? Don't fight the current. If you are a Microsoft shop, Power BI deploys 340% faster than a greenfield tool. If you are on GCP, Looker is the natural path.
4. What is the bottleneck? Be honest about what's broken.
- Insights are slow?
- Non-technical users are helpless?
- Data team is buried in backlog?
Different bottlenecks require different tools.
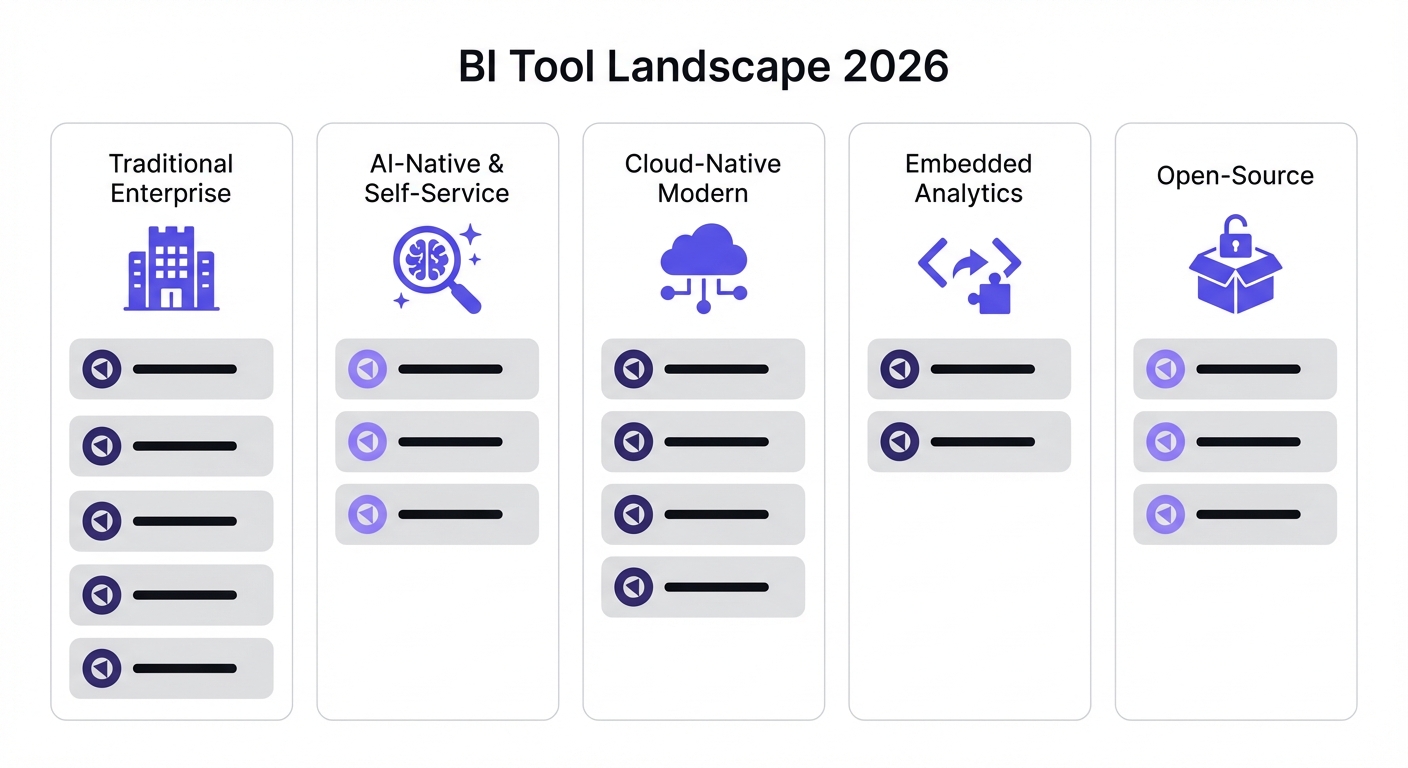
Detailed Tool Comparisons by Category
Traditional Enterprise BI Platforms
These are the incumbents. They have every feature imaginable, massive ecosystems, and enterprise-grade governance. They are built for a world where analysts build, and everyone else watches.
Power BI
Microsoft's platform is the 800lb gorilla. It has 20%+ market share and has led Gartner’s quadrant for 18 years.
Key Strengths:
- Ecosystem: Seamless if you use Excel, Azure, or Teams.
- Price: $14/user/month is unbeatable for enterprise software.
- DAX: Extremely powerful for complex calculations (once you learn it).
Key Weaknesses:
- Learning Curve: DAX is not intuitive.
- Limits: Dataset caps (1GB Pro / 10GB Premium) can be a headache.
- AI: Copilot is technically there, but unreliable in production.
The Verdict: If you are on Office 365, start here.
Pricing: Pro ($14/user/mo), Premium Per User ($24/user/mo), Capacity ($4,995/mo).
Tableau
Owned by Salesforce, Tableau is the visual standard. If you need a dashboard to look beautiful and interactive for an executive presentation, this is the tool.
Key Strengths:
- Visuals: Best-in-class drag-and-drop interface.
- Community: Massive user base with answers to every possible question.
- Maps: Superior geographic visualization.
Key Weaknesses:
- Cost: $75/user/mo for creators is steep.
- Performance: Tableau Cloud can feel sluggish.
- Complexity: Calculated fields get messy fast.
The Verdict: The choice for data storytelling and pixel-perfect exec dashboards.
Pricing: Creator ($75/user/mo), Explorer ($42/user/mo), Viewer ($15/user/mo). Annual billing only.
Qlik Sense
Qlik does one thing differently: the "associative engine." Instead of running a query, it loads data into memory and lets you explore connections dynamically.
Key Strengths:
- Exploration: You don't need a predefined query to find relationships.
- ETL: Powerful built-in data prep.
- Loyalty: High retention because power users love the engine.
Key Weaknesses:
- Scale: Heavy memory usage means performance dips on massive datasets.
- Price: Complex and often expensive.
- Ramp-up: Steeper learning curve than Power BI.
The Verdict: Great for deep exploratory analysis where you don't know the question yet.
Pricing: Cloud starts at $200/mo (10 users). Enterprise requires a sales call.
Oracle Analytics Cloud
Deeply integrated with the Oracle stack. If your data lives in Oracle DBs and Fusion apps, this makes sense. If not, look elsewhere.
Key Strengths:
- Integration: Native connection to Oracle apps.
- Data Prep: Strong transformation features.
- Governance: Enterprise-ready security.
Key Weaknesses:
- Lock-in: Only really shines in Oracle shops.
- UI: Feels dated compared to modern competitors.
The Verdict: The default for Oracle-heavy enterprises.
Pricing: Professional ($16/user/mo), Enterprise ($80/user/mo).
SAP Analytics Cloud
A unified platform for BI, planning, and budgeting. Like Oracle, this is a play for the existing ecosystem (SAP ERP/S4HANA).
Key Strengths:
- Unified: BI and financial planning in one tool.
- Live Data: Native connection to SAP sources.
- Predictive: Built-in analytics features.
Key Weaknesses:
- Isolation: Integration with non-SAP systems is painful.
- UX: Confusing for new users.
- Speed: Large datasets can drag.
The Verdict: Essential for SAP shops needing integrated financial planning.
Pricing: BI ($36/user/mo). Planning requires custom pricing.
IBM Cognos Analytics
The legacy heavyweight. Strong on paginated reporting (pixel-perfect PDFs) and governance, but feels like software from a previous era.
Key Strengths:
- Reporting: Excellent for compliance/regulatory documents.
- AI: Natural language querying (actually decent).
- Deployment: Flexible (Cloud, On-prem, Hybrid).
Key Weaknesses:
- Legacy: Architecture feels old.
- Admin: Complex licensing and setup.
- Mindshare: Declining popularity.
The Verdict: Good for massive enterprises with complex compliance reporting needs.
Pricing: Standard ($11/user/mo), Premium ($45/user/mo).

AI-Native Self-Service Platforms
These tools are built for the "ad hoc" problem. They assume the user doesn't know SQL and shouldn't have to wait for an analyst.
BlazeSQL
BlazeSQL isn't a dashboard tool with a chatbot bolted on; it's AI-native. It connects to your SQL database and lets users query via natural language, with reliability layers (training, review, knowledge notes) built in.
Key Strengths:
- Reliability: Includes mechanisms to teach the AI business logic (so it doesn't hallucinate definitions).
- Format: Outputs dashboards, not just chat answers.
- Self-Serve: Designed for non-technical users to get answers instantly.
Key Weaknesses:
- Visuals: Less pixel-perfect formatting than Tableau.
- Data Source: Requires a SQL database (Snowflake, BigQuery, etc.).
The Verdict: The best pick for teams drowning in ad-hoc questions who want genuine self-service.
Pricing: $400/month (includes 3 users), $50/additional user.
ThoughtSpot
ThoughtSpot pioneered "search-based analytics." Think Google for your data. It works well at scale, provided your data modeling is pristine.
Key Strengths:
- Interface: Search bar is intuitive (zero training required).
- SpotIQ: Automatically surfaces anomalies you didn't look for.
- Embed: Strong embedded capabilities.
Key Weaknesses:
- Prep Work: Data modeling must be perfect for search to work reliably.
- Customization: Visuals are functional, not artistic.
The Verdict: Great for democratizing data access, but be ready to invest in data modeling.
Pricing: Essentials ($25/user/mo), Pro ($50/user/mo). Enterprise deals average ~$140K/year.
Sigma Computing
Sigma is a spreadsheet interface for your cloud data warehouse. It feels like Excel, but handles billions of rows directly in Snowflake/BigQuery/Databricks.
Key Strengths:
- Familiarity: If you know Excel, you know Sigma.
- Power: No extracts—direct connection to the warehouse.
- Collaboration: Strong multi-user features.
Key Weaknesses:
- Visuals: Discovery features lag behind Tableau.
- Speed: Only as fast as your warehouse queries.
The Verdict: The dream tool for Finance and Ops teams who refuse to leave spreadsheets.
Pricing: Starts ~$300/mo. Enterprise is custom.
Cloud-Native Modern BI
Built for the Modern Data Stack (dbt, Snowflake, BigQuery). These tools usually emphasize a "semantic layer" to keep metrics consistent.
Looker
Now part of Google Cloud. Looker's superpower is LookML—a coding layer where you define metrics once, and they apply everywhere.
Key Strengths:
- Governance: LookML ensures "Revenue" means the same thing in every report.
- GCP: Deep integration with BigQuery.
- Git: Version control for your analytics.
Key Weaknesses:
- Curve: LookML is hard to learn.
- Cost: High entry price and opaque enterprise billing.
- Visuals: Functional, but not "wow."
The Verdict: The standard for data teams on Google Cloud who prioritize governance over ease of use.
Pricing: Platform fee + user fee. Minimum ~$5K/mo. Avg deal ~$150K/year.
Domo
The "all-in-one" box. Connectors, ETL, storage, and visualization in a single platform.
Key Strengths:
- Speed: 1,000+ connectors means you can get data flowing fast.
- Mobile: Excellent mobile app.
- ETL: Magic ETL is user-friendly.
Key Weaknesses:
- Cost: Credit-based pricing is complex and scales aggressively.
- Lock-in: Once your data is in Domo, it's hard to move.
The Verdict: Good for organizations that want one vendor to handle the entire pipeline.
Pricing: Credit-based. Deals often range from $50K to $1M+.
Amazon QuickSight
The AWS native option. It's usage-based, meaning you only pay when people actually log in.
Key Strengths:
- Cost: Pay-per-session ($0.30) is a massive saver for occasional users.
- Speed: SPICE engine is fast.
- Integration: Native to AWS.
Key Weaknesses:
- Features: Basic compared to Power BI/Tableau.
- AI: Users report the "Q" feature is underwhelming.
The Verdict: The logical choice for AWS shops with many occasional users.
Pricing: Reader ($3/mo or $0.30/session), Author ($24/mo).
Holistics
"Looker-lite" for the modern stack. It offers a semantic layer and "dashboard as code" without the massive Looker price tag.
Key Strengths:
- dbt: Strong integration.
- Code: Version control for dashboards.
- Price: Flat pricing is predictable.
Key Weaknesses:
- Community: Smaller ecosystem.
- Drilldown: Limited compared to Power BI.
The Verdict: Smart choice for dbt teams who want governance without Looker's complexity.
Pricing: Starts $800/mo (flat for 10 users).
Embedded Analytics Platforms
You aren't analyzing data; you are building a product. These tools are for embedding charts into your SaaS app.
Sisense
Focused heavily on embedding. Offers robust white-labeling and API capabilities.
Key Strengths:
- Embedding: Strong multi-tenancy and customization.
- Data: Handles complex models well.
Key Weaknesses:
- Customization: Dashboard styling is more limited than competitors.
- Momentum: A 2024 security breach and declining Gartner position have hurt reputation.
The Verdict: Solid for ISVs/SaaS, but do your due diligence on security and roadmap.
Pricing: Starts ~$21K/year.
GoodData
"Headless BI." They provide the analytics engine via API; you build the front end.
Key Strengths:
- Architecture: API-first design.
- Scale: Strong multi-tenancy for SaaS.
- Flexibility: Build exactly the UX you want.
Key Weaknesses:
- Effort: Requires developers.
- Visuals: Limited out-of-the-box options.
The Verdict: For dev teams building custom analytics products.
Pricing: Contact sales.
Open-Source BI
Free software, paid with your time. Great for customization and technical teams.
Metabase
The startup favorite. Clean, simple, and sets up in 5 minutes.
Key Strengths:
- UX: Very user-friendly for non-technical folks.
- Setup: Docker image -> running instance in minutes.
- Cost: Free self-hosted version.
Key Weaknesses:
- Depth: Limited advanced analytics.
- Scale: Performance chokes on massive datasets.
The Verdict: The default choice for startups and small teams.
Pricing: Free (self-host). Cloud starts $85/mo.
Apache Superset
The power-user option. More visualization types and extensibility than Metabase, but harder to use.
Key Strengths:
- Visuals: 40+ chart types.
- Custom: Plugin architecture allows endless tweaking.
- Cloud-Native: Scalable design.
Key Weaknesses:
- Curve: Steeper than Metabase.
- Setup: Requires technical maintenance.
The Verdict: For technical teams who want a scalable, customizable open-source platform.
Pricing: Free (self-host). Managed service (Preset) $20/user/mo.
Redash
SQL-first. Write query -> Visualize result -> Share. Simple.
Key Strengths:
- Simple: No fluff.
- Connectors: 35+ sources.
- Cost: Free.
Key Weaknesses:
- SQL Required: Not for non-technical users.
- Stagnation: Development slowed post-Databricks acquisition.
The Verdict: Great for SQL-proficient teams who just need to visualize queries.
Pricing: Free (open-source).
Lightdash
The new kid on the block, built specifically for dbt users. It turns your dbt project into a BI tool.
Key Strengths:
- dbt: Native integration.
- Semantic Layer: Uses your existing dbt models.
- Open Source: Self-hostable.
Key Weaknesses:
- Dependency: Useless without dbt.
- Maturity: Smaller community and feature set.
The Verdict: If you live in dbt, look at this.
Pricing: Cloud starts $800/mo. Self-host free.
Feature Comparison Matrix
| Feature | Power BI | Tableau | Looker | BlazeSQL | ThoughtSpot | Metabase |
|---|---|---|---|---|---|---|
| Data Connectivity | ||||||
| Native connectors | 100+ | 80+ | 50+ | 10+ | 30+ | 30 |
| Real-time data | ✓ | ✓ | ✓ | ✓ | ✓ | Limited |
| Cloud DW optimization | ✓ | ✓ | ✓ | ✓ | ✓ | ✓ |
| Self-Service | ||||||
| Natural language query | Copilot | Ask Data | Gemini | Native | Native | Metabot |
| Drag-and-drop | ✓ | ✓ | Limited | Via AI | Limited | ✓ |
| Spreadsheet interface | Limited | ✗ | ✗ | ✗ | ✗ | ✗ |
| Governance | ||||||
| Row-level security | ✓ | ✓ | ✓ | ✓ | ✓ | ✓ |
| Audit logs | ✓ | ✓ | ✓ | ✓ | ✓ | Paid |
| SOC 2 certified | ✓ | ✓ | ✓ | ✗ | ✓ | Paid |
| Visualization | ||||||
| Chart types | 50+ | 50+ | 30+ | 15+ | 20+ | 25+ |
| Custom visuals | ✓ | ✓ | Limited | Limited | Limited | Limited |
| Mobile support | ✓ | ✓ | ✓ | ✓ | ✓ | ✓ |
| Deployment | ||||||
| Cloud | ✓ | ✓ | ✓ | ✓ | ✓ | ✓ |
| On-premise | ✓ | ✓ | Desktop | Desktop | ✓ | ✓ |
| Embedded | ✓ | ✓ | ✓ | ✓ | ✓ | ✓ |
The AI Features Reality Check
Let's be blunt: most "AI" in BI tools is marketing hype. We dug into user feedback to separate the useful from the useless.
The Good (Production-Ready)
- ThoughtSpot SpotIQ: Actual utility. It finds insights you didn't ask for.
- Qlik Insight Advisor: Works well for natural language queries out of the box.
- BlazeSQL: Designed as AI-first. Mechanisms like "Knowledge Notes" allow you to fix the AI's logic, making it reliable enough for real work.
The Bad (Beta/Preview)
- Power BI Copilot: Reddit is ruthless here—users call it "terrible" and "useless." The Q&A visual works if you manually train it, but the generative features aren't there yet.
- Tableau Pulse: Still too new to trust for critical workflows.
- Amazon QuickSight Q: Users report it struggles with anything beyond basic documentation lookups.
The Ugly (Marketing Theater)
Many tools slap an "AI" label on basic statistics (trend lines, standard deviation). That's math, not AI.
The Core Problem: Bolt-on AI can write SQL, but it doesn't know your business context. It doesn't know that "churn" excludes trial accounts, or that your fiscal year starts in February. Purpose-built tools (like BlazeSQL) include workflows to capture this context. Bolt-on features usually just guess based on column names—and usually fail.
Implementation Considerations
Reality Check: Timelines
According to BARC data on 2,500+ projects:
- Simple: 1-3 months.
- Median: ~4 months.
- Complex: 6-12+ months.
Success Factors
The #1 reason projects fail isn't the software—it's lack of resources. If you treat BI as a "side of desk" project, it will fail. You need dedicated owners.
Also, don't fight your ecosystem. If you use Microsoft, Power BI is 340% faster to deploy than a competitor.
The Real Cost
The license fee is just the tip of the iceberg.
| Component | Power BI | Tableau | Looker |
|---|---|---|---|
| Software (10 users) | $1,680/year | $9,000/year | $50,000+/year |
| Training | $5k - $10k | $10k - $20k | $15k - $30k |
| Data Engineering | Varies | Varies | Essential |
| Infrastructure | Azure costs | Server costs | BigQuery costs |
| Realistic Year 1 | $10k - $20k | $25k - $40k | $80k - $150k |
How to Run a Proper POC
Most POCs (Proof of Concepts) are a waste of time because they test features, not reliability. Do this instead:
- Narrow the Scope: Pick one team. You cannot test a tool for the whole company at once.
- Test Reliability First: Don't look at chart types yet. Can the tool reliably answer questions?
- Use Real Questions: Gather 15 actual questions users asked last week. Include the messy ones that require business context.
- Measure Outcomes: Did it give the right answer? How long did it take? Would the user actually log in to do this?
- Involve the Skeptics: Include someone who doesn't know the data. If they can't use it, your "self-service" dream is dead.
Timeline: If you can't prove value in 2-4 weeks, the tool is too complex. Move on.
Still evaluating? Our 2-minute assessment can help narrow down which tools to include in your POC.
The Verdict
There is no single "best" tool. Stop looking for a unicorn.
The winning pattern we see in 2026 is hybrid:
- Keep the Legacy Tool: Use Power BI / Tableau / Looker for the heavy lifting—financial reporting, board decks, and standardized dashboards.
- Add an AI Layer: Use BlazeSQL / ThoughtSpot / Sigma for the 80% of ad-hoc questions that clog up your data team's backlog.
- Go Open Source only if you have more engineering time than budget.
73% of implementations fail because companies buy for features instead of fit. Start with your actual problem, not the vendor's hype.
This is fine, but I don't know that you want to use popularity as a basis for choosing a BI tool. Choosing a BI tool has to do with your organization. Are you small or large, data savvy or not, what's your budget, are you viz or grid heavy, do you need pixel-perfect reports, are you an Oracle shop, are you a Microsoft shop, are there already preferred tools in-house, and so on?
View on Reddit