


Best BI Tools for Amazon Redshift: A Practical Comparison

You shouldn't need a month of vendor demos and a spreadsheet with 47 columns just to pick a visualization tool. But here we are. The Redshift BI landscape is messy: AWS pushes QuickSight hard, legacy vendors are frantically bolting "AI" onto old architectures, and new tools promise "self-service" without explaining how they handle messy real-world data.
This guide cuts the fluff. We analyzed 13 tools connecting to Redshift, pulling from official docs, Reddit threads, and actual implementation logs. We’re looking for what works in production, not just what looks shiny in a sales deck.
What you'll get:
- Which tools actually handle Redshift scale (vs. those that choke).
- The reality of AI/NLQ features vs. the marketing hype.
- Implementation landmines that waste weeks of engineering time.
- How to match the tool to your actual team composition.
Not sure which solution is right for your needs? Take our quick 2-minute assessment to get personalized recommendations.
Quick Comparison: Redshift BI Tools at a Glance
If you're scanning, here is the high-level breakdown:
| Tool | Best For | Pricing Model | AI/NLQ | Learning Curve | Self-Service Level |
|---|---|---|---|---|---|
| AWS QuickSight | AWS-native stacks; simple dashboards | Per-user + SPICE capacity | Q (extra cost) | Low-Medium | Limited |
| Tableau | Pixel-perfect, complex visualizations | Per-user ($70-$12/mo) | Ask Data | High | Medium |
| Power BI | Microsoft shops; enterprise reporting | Per-user ($10-$20/mo) | Copilot (limited) | High | Medium |
| BlazeSQL | AI-native self-service; ad hoc analysis | Seat-based | Core feature | Low | High |
| ThoughtSpot | Search-driven analytics | Quote-based (high) | Sage | Medium | High |
| Looker | Governed analytics; semantic modeling | Quote-based (high) | Limited | High | Medium |
| Metabase | Budget-conscious teams; simple queries | Free or $85/mo+ | Limited | Low | Medium |
| Apache Superset | Technical teams; heavy customization | Free (self-hosted) | Emerging | Medium-High | Low-Medium |
| Sigma Computing | Spreadsheet users; cloud warehouses | Per-user ($25-$75/mo) | Emerging | Low | High |
| Mode | Data teams; SQL + notebooks | Per-user | AI Assist | Medium | Medium |
| Hex | Data science; collaborative analysis | Per-user | AI features | Medium | Medium |
| Sisense | Embedded analytics | Quote-based | Limited | High | Medium |
| Holistics | Code-based modeling; reporting | Per-user ($150+/mo) | Emerging | Medium | Medium |
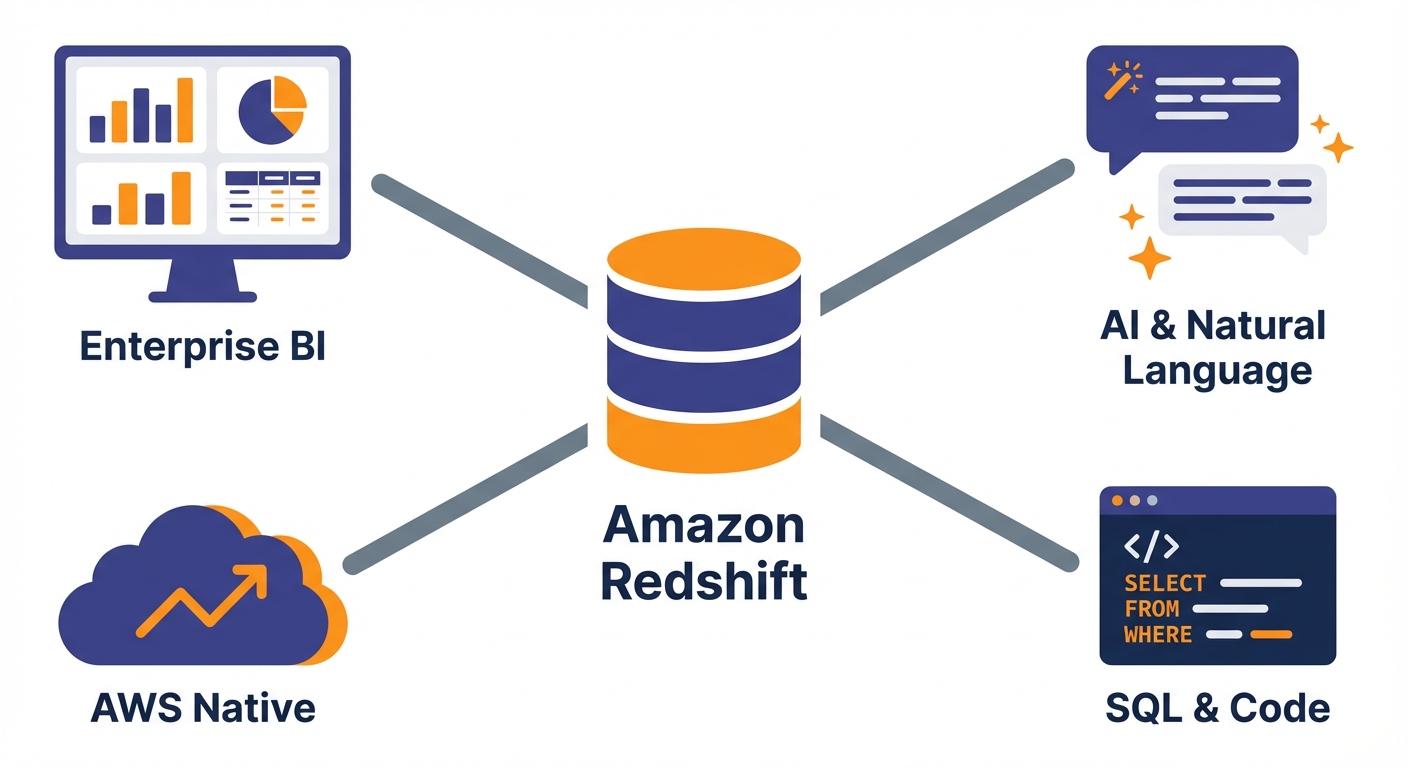
The Landscape: Why Redshift Integrations Vary
Not all "Redshift support" is created equal. Understanding the mechanics helps you avoid picking a tool that connects easily but fails at scale.
1. Connection methods are the bottleneck. Some tools use native Redshift connectors optimized for the architecture. Others rely on generic ODBC/JDBC drivers. This isn't just semantics—generic drivers often generate inefficient queries. As one Reddit user noted, "BI tools generate terrible SQL," which can slam your leader node and spike your AWS bill.
2. Live Query vs. Extract (Import).
- Extract (e.g., QuickSight SPICE, Power BI Import): You pull data into the tool’s cache.
- Pro: Fast dashboards.
- Con: Data is stale until the next refresh.
- Live Query: The tool hits Redshift for every chart load.
- Pro: Real-time data.
- Con: Can crush your cluster concurrency if not managed well.
3. The AI Reality Check. Every vendor claims they have AI now. Most are marketing theater. The gap between a demo on a clean CSV and production querying on a complex schema is massive. We'll call out which tools actually deliver here.
The AWS-Native Option
AWS QuickSight
QuickSight is the path of least resistance. It sits in your console, talks to IAM, and integrates with VPCs easily.
The Good:
- Frictionless connection (especially for private subnets).
- SPICE in-memory engine makes dashboards snappy.
- Very cheap compared to enterprise heavyweights.
- Native support for Redshift Serverless.
The Bad: It’s not an enterprise BI platform. It’s for AWS users who need charts. One user summarized it perfectly: "It's not really built to be enterprise-level BI. It's made for AWS users who want really, really simple visualizations."
The lack of a semantic layer hurts. Business logic gets fragmented across datasets.
AI Verdict (QuickSight Q): It offers natural language querying, but users report it’s confusing to set up. You need significant effort to "train" it for non-technical users.
Best For: Teams deep in AWS needing simple dashboards. Often a stepping stone. Pricing: Reader ~$5/mo, Author ~$24-$34/mo + SPICE capacity.
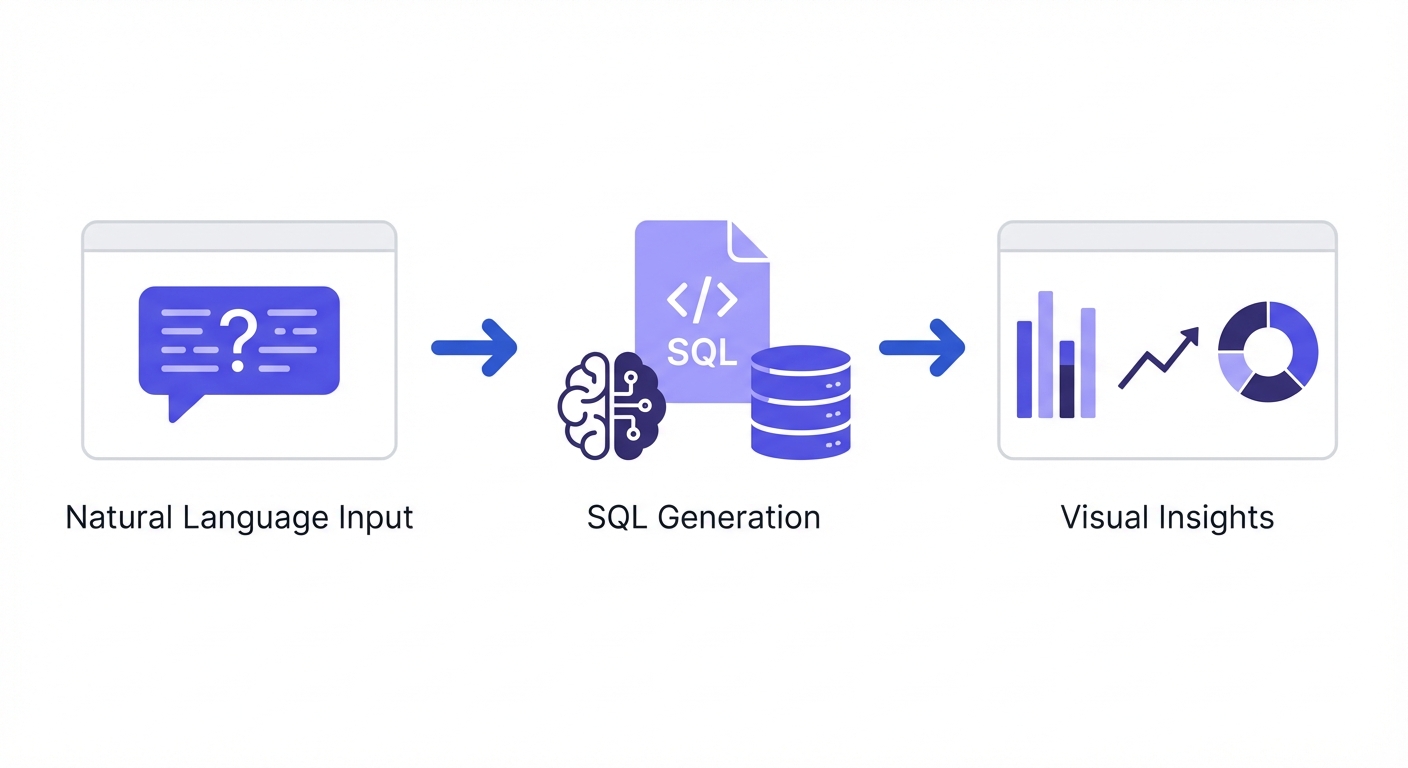
AI-Native Analytics Platforms
These tools were built around LLMs and natural language, not retrofitted with a chatbot sidebar.
BlazeSQL
BlazeSQL is designed for the "text-to-SQL" workflow. It connects to Redshift and lets users query via chat, focusing heavily on getting the SQL right.
The Good:
- Generates and executes SQL from natural language (no SQL knowledge required).
- Includes reliability features: knowledge notes, training questions, and review steps.
- Dashboards are built through conversation.
- Passive learning means it gets smarter as your team corrects it.
The Reality: BlazeSQL is for teams where data access is the bottleneck. If your analysts are drowning in "can you pull this list?" tickets, this offloads that work.
AI Reliability: Most AI tools fail because they lack context (e.g., knowing to exclude internal test accounts). BlazeSQL uses structured workflows to capture these definitions so the AI stops guessing.
Best For: True self-service for business users and speeding up technical teams. Pricing: Seat-based. Starts ~$400/mo for 3 users.
ThoughtSpot
ThoughtSpot pioneered "search-driven analytics" and has pivoted hard to AI with "Sage."
The Good:
- Search interface is intuitive for non-techies.
- Live connections (no extracts).
- SpotIQ automates insight detection.
- Excellent embedded analytics.
The Bad: It demands perfection from your data model.
One user noted: "ThoughtSpot generally assumes the data is already perfectly aggregated and joined in your warehouse." If your data is messy, ThoughtSpot will struggle.
AI Verdict: Sage is "generally accurate" according to TrustRadius, but requires training and feedback. It’s powerful but heavy on setup.
Best For: Enterprises with pristine data models and budget for setup. Pricing: Quote-based ($3k-$10k+/month).
Traditional Enterprise BI
The heavyweights. You know them, your CFO knows them.
Tableau
The gold standard for visualization. If you need it to look beautiful, you use Tableau.
The Good:
- Unmatched chart variety and visual control.
- Flexible (Extract or Live).
- Stakeholders already know how to read it.
- Massive community support.
The Bad: Scale is tricky. One user warned: "No BI tool will really handle that scale well. Work on creating views in Redshift that contain only the required columns."
AI Verdict: "Ask Data" exists, but it’s rarely the primary use case. It’s still a drag-and-drop tool at heart.
Best For: Visual quality and analyst-led reporting. Pricing: ~$70/mo (Creator), ~$12/mo (Viewer).
Microsoft Power BI
The default for Microsoft shops. Great pricing, strong governance.
The Good:
- Deep integration with Office 365.
- DAX allows for complex calculation logic.
- Import mode is very fast.
- Cheap entry point.
The Bad: DirectQuery on Redshift is sluggish.
You are often forced into Import mode, which means managing refresh schedules and stale data. Also, gateway config for private clusters is a pain.
AI Verdict: Copilot is heavily marketed, but currently better at helping you build reports than letting users query data.
Best For: Microsoft ecosystems willing to accept data latency (Import mode). Pricing: Pro ~$10/user/mo, Premium ~$20/user/mo.
Looker
Google’s play. It’s all about LookML—a code-based semantic layer.
The Good:
- Single source of truth via LookML.
- Version control (Git integration).
- Persistent derived tables handle complex transforms.
The Bad: Steep learning curve. You need a data team to write and maintain LookML. It’s expensive and slow to deploy.
Best For: Teams that want strict governance and have engineers to manage it. Pricing: Quote-based ($3k-$10k/month).
Sisense
Focuses on embedded analytics and "infusing" apps with data.
The Good:
- Great for white-labeling/embedding.
- Elasticube (in-memory) handles complex data well.
- Supports Redshift Serverless.
The Bad: Post-acquisition feedback has been rough regarding support and knowledge drain. "What a shitshow it was watching Sisense destroy all institutional knowledge from the Periscope team," noted one Reddit user.
Best For: Embedded use cases. Pricing: Quote-based ($20k+/year range).
Open Source Options
If you have more engineering time than budget.
Metabase
The people's champion. Friendly, simple, and (can be) free.
The Good:
- Easy setup.
- Non-technical users can actually use the UI.
- Free self-hosted version is solid.
The Bad: It struggles with complexity.
It also lacks modern AI features, feeling a bit "dated in 2025."
Best For: Internal reporting on a budget. Pricing: Free (self-hosted); Cloud starts ~$85/mo.
Apache Superset
Airbnb’s gift to the world. Powerful, but technical.
The Good:
- Highly customizable.
- Strong SQL IDE.
- No license costs.
The Bad: You are the support team. Permission management for Redshift schemas can be a headache.
Best For: Technical teams who want control and flexibility. Pricing: Free (self-hosted).
Modern Cloud BI Platforms
Sigma Computing
It looks like Excel but queries Redshift directly.
The Good:
- Familiar spreadsheet interface.
- Live queries (no extracts).
- Great for ad hoc analysis.
The Bad: Watch out for performance. "The leader node has been at 100% cpu for at least a month... Sigma is running crazy queries all day," said one user. Note: Sigma does not currently support Redshift Serverless.
Best For: Spreadsheet power users. Pricing: ~$25-$75/user/mo.
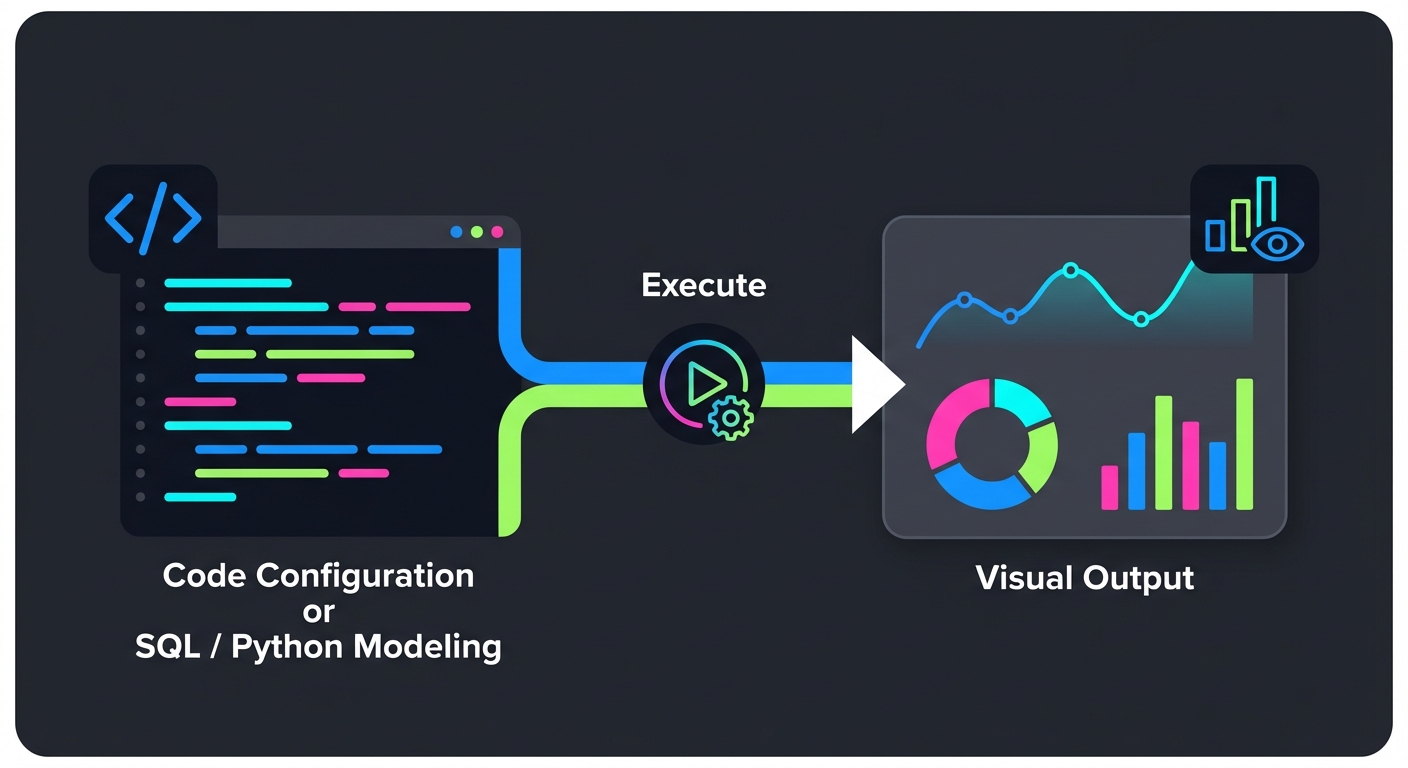
Mode
SQL + Python + Charts.
The Good:
- Bridges the gap between data science and BI.
- Strong collaboration features.
- Bridge connector handles private networks well.
Best For: Data teams who code. Pricing: Per-user.
Hex
Notebooks for the modern era.
The Good:
- Interactive data apps.
- Great SQL/Python interop.
- SSH support for Redshift.
The Bad: Visualizations aren't as polished for non-technical stakeholders compared to Tableau.
Best For: Data science collaboration. Pricing: Per-user (has a free tier).
Holistics
Code-based modeling without the Looker price tag.
The Good:
- Git integration.
- Strong scheduled reporting.
- Direct/SSH connection options.
The Bad: UI lacks the polish of bigger competitors.
Best For: "LookML on a budget." Pricing: Starts ~$150/mo.
How to Choose: A Decision Framework
Don't overcomplicate this. Start with who is using it.
- Technical Users (Analysts/Engineers): Look at Mode, Hex, or Superset*. They embrace SQL/Python rather than hiding it.
- Business Users (Viewers): Need dashboards built for them? Tableau, Power BI, or Looker. Need to ask their own questions? BlazeSQL (AI-native) or ThoughtSpot (Search).
- Budget Constraints: Enterprise tools (ThoughtSpot, Looker, Sisense) are expensive ($3k+/mo minimums). Predictable/Low cost: QuickSight, Metabase, Power BI, BlazeSQL.
- Redshift Specifics: Serverless? Avoid Sigma for now. Private VPC? Ensure the tool supports PrivateLink, VPN, or SSH tunneling.
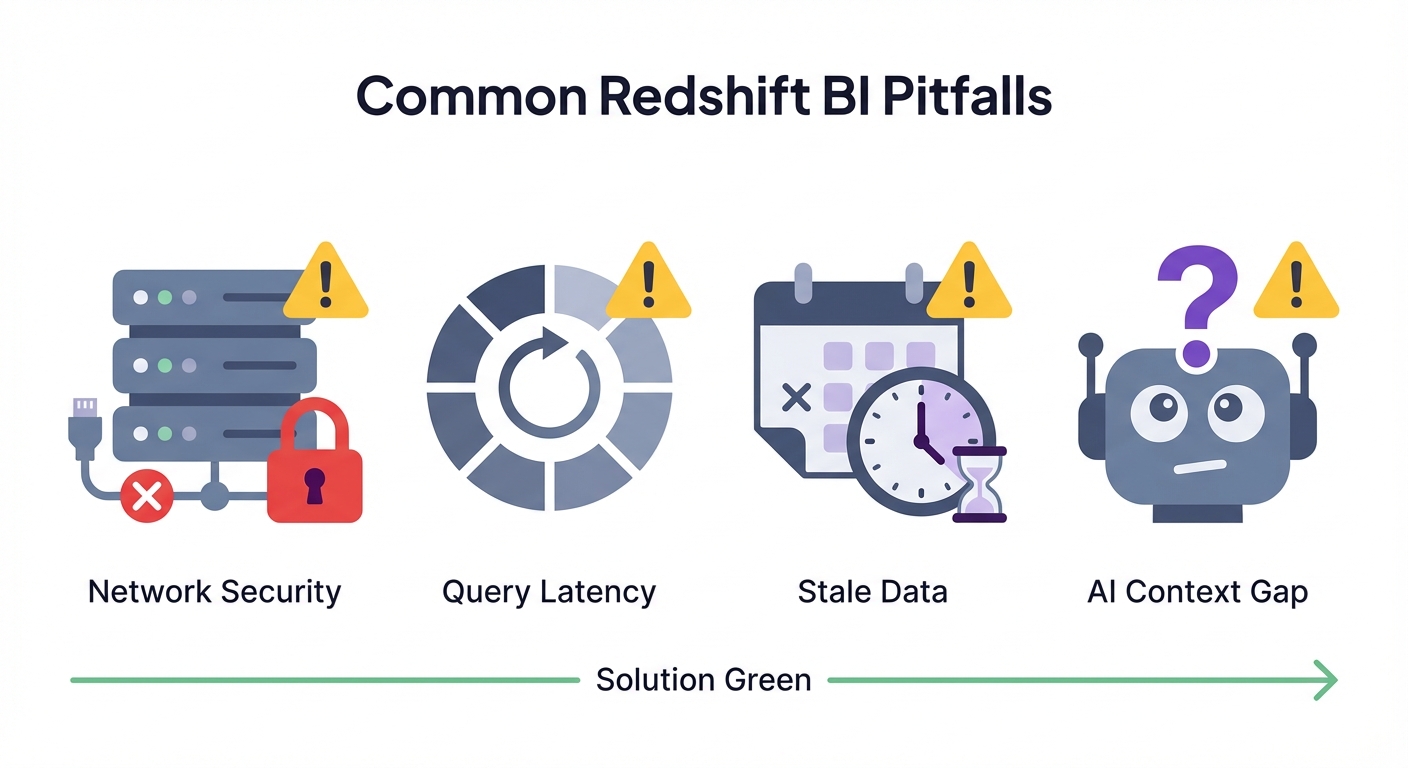
Common Implementation Pitfalls
We see teams waste weeks on these three issues.
1. Network & Security (The #1 Blocker) It’s never the tool; it’s the network. Private Redshift clusters need security group whitelisting, VPC peering, or a bastion host. Fix: Check if the tool’s IPs can reach your cluster port (5439) before you start building dashboards.
2. The "Bad SQL" Bottleneck Tools that generate inefficient queries will clog your WLM queues. Fix: Use materialized views for heavy aggregations. Don't make Redshift calculate "Sales Year to Date" from raw rows every time a user refreshes a chart.
3. The Context Gap in AI You plug in an AI tool, ask "What's our churn?", and it gives you the wrong number. Why? because "Churn" involves complex logic (e.g., excluding trial users) that isn't in your column names. Fix: You must use a tool that allows you to define these business rules explicitly.
Making AI Analytics Actually Work
"Ask questions in plain English" is a great promise. It usually fails because AI doesn't know your business context.
- The Problem: An LLM knows SQL syntax, but it doesn't know that cust_type_id = 4 means "VIP Client."
- The Solution: Success comes from tools that capture this context—metrics definitions, exclusions, and business logic—in a structured way.
Don't ask "Does this tool use AI?" Ask "How do I teach this tool my business definitions?"
Bottom Line
- QuickSight: Fine for simple AWS-native dashboards. You might outgrow it.
- Power BI / Tableau: The standard for governed, analyst-built reporting.
- BlazeSQL: The best bet for genuine self-service via AI, provided you set up the context.
- Metabase / Superset: Great for technical teams on a budget.
- Looker / ThoughtSpot: Powerful enterprise options, but require heavy setup and high cost.
Stop looking for the "best" tool. Look for the one your team will actually use.
The measures can't calculate themselves independently of visuals... So when you use 'over' kinds of calculations, you have to be sure to include all the partitioning variables in the visualizations.
View on Reddit